 Site Menu
4. Financial Administration – Expenses – Third Party Report – A Comparative Look at Third Party Information from the 2011, 2015 and 2019 Federal General Elections
Third parties carry out various types of activities to promote or oppose political parties or candidates, from canvassing to posting on websites to advertising. The Canada Elections Act sets limits on expenses that a third party can incur to carry out regulated activities. This chapter looks at the extent of third party spending and the categories of expenses they reported for the 2011, 2015 and 2019 general elections.
4.1. Expenses and limits
When a third party conducts a regulated activity during a pre-election period or an election period, the expense for that activity must be reported and is subject to a spending limit. This is true even if the third party paid the expense before the period started.
There is an overall limit on total expenses and a local limit in electoral districts. Expenses for a regulated activity always count against the overall limit. They also count against the local limit in a given electoral district, if the activity promotes or opposes one or more specific candidates in that district. An activity does not have to take place within the electoral district to count locally.
The third party limits for general elections from 2011 to 2019 varied considerably because of the legislation in place at the time. The limit was lowest in 2011 when only a third party's election advertising was regulated and the election period was 38 days. In 2015, election advertising was still the only regulated activity, but the limit rose significantly because it was prorated for the longer election period of 78 days. In 2019, although new legislation removed prorated limits, the base limit was raised in the law because more types of third party activities became regulated. This was also the first year with a pre-election period for a fixed-date election.
| Election | Where the limit applies | Pre-election period (fixed-date election) |
Election period |
|---|---|---|---|
| 2011 | Local | n/a | $3,765 |
| 2011 | Overall | n/a | $188,250 |
| 2015 | Local | n/a | $8,788 |
| 2015 | Overall | n/a | $439,411 |
| 2019 | Local | $10,234 | $4,386 |
| 2019 | Overall | $1,023,400 | $511,700 |
4.1.1. Total expenses by general election
As mentioned in previous chapters, the context for spending at the 2011 and 2015 elections was different from that of the 2019 election. Election advertising was the only regulated activity in 2011 and 2015. Third parties may have been spending on campaign activities other than election advertising in those years, but they were not regulated or reported.
Third parties spent over $1.2 million on election advertising at the 2011 election, for an average of $22,550 per third party and $32,639 per day. They spent almost $6.0 million at the 2015 election (an increase of 381% from 2011), for an average of $51,828 per third party (an increase of 130%) and $76,414 per day (an increase of 134%). The increase in total spending is partly attributed to a longer election period and a higher number of registered third parties. But the similar increases in average and daily spending suggest that third parties generally chose to spend more on election advertising in 2015.
In 2019, not only were more activities regulated, but the election period was preceded by the first federally regulated pre-election period, running for 73 days before the election period began. Third parties that registered could choose to be active in one or both periods.
Third parties spent almost $11.7 million on regulated activities at the 2019 general election, including in the pre-election period, for an average of $77,440 per third party. They spent just over $6.4 million on election advertising (an increase of 7% from 2015), for an average of $42,430 (a decrease of 18% from 2015). Trends are not drawn from 2011 and 2015 to 2019 because of the difference in regulated activities.
| Election | Total expenses | Average per third party |
|---|---|---|
| 2011 | $1,240,270 | $22,550 |
| 2015 | $5,960,255 | $51,828 |
| 2019 | $11,693,429 | $77,440 |
4.1.2. Proportion of expenses limit reached by type of third party
Most third parties stayed well below the spending limit of $188,250 at the 2011 election. Some 84% of registered third parties spent 25% or less of the limit, with 16% registering but not spending at all. Groups with no governing body and individuals all spent 25% or less. In the highest tiers, 7% of third parties spent more than 50% of the limit, with 4% of third parties spending more than 75%.
| % of expense limit used | Corporation | Group – governing body | Group – no governing body | Individual | Labour organization | Total |
|---|---|---|---|---|---|---|
| Nil | 0 | 2 | 3 | 2 | 2 | 9 |
| >0% to 25% | 4 | 12 | 10 | 5 | 6 | 37 |
| >25% to 50% | 0 | 3 | 0 | 0 | 2 | 5 |
| >50% to 75% | 1 | 0 | 0 | 0 | 1 | 2 |
| >75% to 100% | 1 | 0 | 0 | 0 | 1 | 2 |
| Total | 6 | 17 | 13 | 7 | 12 | 55 |
In 2015, a similar pattern emerged, although there was a higher spending limit of $439,411. Some 84% of registered third parties spent 25% or less of the limit (no change from 2011), with 10% registering but not spending at all (a decrease of 6 percentage points from 2011). Groups without a governing body, individuals and registered charities all spent 25% or less. In the highest tiers, 5% of third parties spent more than 50% of the limit, with 4% of third parties spending more than 75%.
| % of expense limit used | Corporation | Group – governing body | Group – no governing body | Individual | Labour organization | Registered charity | Total |
|---|---|---|---|---|---|---|---|
| Nil | 2 | 2 | 3 | 0 | 4 | 0 | 11 |
| >0% to 25% | 22 | 24 | 19 | 7 | 10 | 4 | 86 |
| >25% to 50% | 2 | 0 | 0 | 0 | 7 | 0 | 9 |
| >50% to 75% | 0 | 0 | 0 | 0 | 4 | 0 | 4 |
| >75% to 100% | 2 | 1 | 0 | 0 | 2 | 0 | 5 |
| Total | 28 | 27 | 22 | 7 | 27 | 4 | 115 |
In 2019, in the pre-election period, most third parties were far from reaching the overall limit of just over $1.0 million. Some 98% of registered third parties spent 25% or less of the expenses limit, with 63% of third parties not spending at all during this period. One individual spent more than 25% of the limit, one labour organization spent more than 50%, and one labour organization spent more than 75%.
In the election period, more third parties spent closer to the limit of $511,700, but the majority still spent well below it. Some 86% of registered third parties spent 25% or less of the limit, with 26% not spending at all during this period. Again, groups without a governing body, registered charities and individuals all spent 25% or less of the expenses limit. In the highest tiers, 9% of third parties spent more than 50% of the limit, with 4% of third parties spending more than 75%.
| % of expense limit used | Corporation | Group – governing body | Group – no governing body | Individual | Labour organization | Registered charity | Total |
|---|---|---|---|---|---|---|---|
| Nil | 33 | 19 | 19 | 5 | 12 | 7 | 95 |
| >0% to 25% | 22 | 9 | 5 | 5 | 10 | 2 | 53 |
| >25% to 50% | 0 | 1 | 0 | 0 | 0 | 0 | 1 |
| >50% to 75% | 0 | 0 | 0 | 0 | 1 | 0 | 1 |
| >75% to 100% | 0 | 0 | 0 | 0 | 1 | 0 | 1 |
| Total | 55 | 29 | 24 | 10 | 24 | 9 | 151 |
| % of expense limit used | Corporation | Group – governing body | Group – no governing body | Individual | Labour organization | Registered charity | Total |
|---|---|---|---|---|---|---|---|
| Nil | 12 | 4 | 6 | 8 | 6 | 4 | 40 |
| >0% to 25% | 34 | 19 | 18 | 2 | 12 | 5 | 90 |
| >25% to 50% | 4 | 2 | 0 | 0 | 2 | 0 | 8 |
| >50% to 75% | 3 | 3 | 0 | 0 | 1 | 0 | 7 |
| >75% to 100% | 2 | 1 | 0 | 0 | 3 | 0 | 6 |
| Total | 55 | 29 | 24 | 10 | 24 | 9 | 151 |
4.1.3. Total expenses by top spenders
As shown above, a minority of third parties reached a high proportion of the overall expenses limit in elections from 2011 to 2019. This section takes a closer look at the top spenders.
In the 2011 election, four third parties spent more than $100,000: two labour organizations and two corporations. In 2015, 10 third parties spent more than $200,000: seven labour organizations, two corporations and one group with a governing body (which was created by a labour organizationFootnote 11). In 2019, 13 third parties spent more than $300,000: four labour organizations, five corporations and four groups with a governing body (of which one corporation and one group were created by labour organizationsFootnote 12).
While the same third party types, namely, labour organizations and corporations, topped the spending list at each election, the entities were not always the same. The Public Service Alliance of Canada was the only third party to reach the top spender list at all three elections. Four labour organizations or their entities appeared on the 2015 and 2019 lists: Canadian Labour Congress (including its entity Fairness Works), Let's Build Canada (a coalition of construction and trade unions), Unifor and United Steelworkers (USW). One group with a governing body, Friends of Canadian Broadcasting, appeared on the 2015 and 2019 lists.
| Election | Third party name | Third party type | Total expenses |
|---|---|---|---|
| 2011 | The Professional Institute of the Public Service of Canada | Labour organization | $166,165 |
| 2011 | AVAAZ | Corporation | $152,089 |
| 2011 | Public Service Alliance of Canada | Labour organization | $133,512 |
| 2011 | CMI - ICM Canadian Migration Institute | Corporation | $105,260 |
| 2015 | United Steelworkers | Labour organization | $431,640 |
| 2015 | Let's Build Canada | Corporation | $428,975 |
| 2015 | Canadians United for Change | Group - governing body | $425,462 |
| 2015 | Public Service Alliance of Canada | Labour organization | $390,237 |
| 2015 | Friends of Canadian Broadcasting | Corporation | $332,687 |
| 2015 | Canadian Labour Congress | Labour organization | $306,488 |
| 2015 | Unifor | Labour organization | $297,955 |
| 2015 | British Columbia Nurses' Union | Labour organization | $256,872 |
| 2015 | Canadian Media Guild (CMG) | Labour organization | $237,033 |
| 2015 | Canadian Union of Postal Workers "CUPW" | Labour organization | $208,569 |
| 2019 | Unifor | Labour organization | $1,405,399 |
| 2019 | USW | Labour organization | $1,133,246 |
| 2019 | Friends of Canadian Broadcasting | Group - governing body | $708,226 |
| 2019 | Fairness Works | Group - governing body | $572,499 |
| 2019 | Let's Build Canada | Corporation | $459,577 |
| 2019 | Canadian Federation of Nurses Union | Labour organization | $442,253 |
| 2019 | Canadian Medical Association | Corporation | $430,638 |
| 2019 | Canadians United for Change | Group - governing body | $400,060 |
| 2019 | 2713350 Ontario Inc. (Schroeder Policy Group Inc.) | Corporation | $384,247 |
| 2019 | Canada Proud | Corporation | $359,421 |
| 2019 | Public Service Alliance of Canada | Labour organization | $345,004 |
| 2019 | Canadian Association of Petroleum Producers | Group - governing body | $311,698 |
| 2019 | Canada: Powered By Women Inc. | Corporation | $311,259 |
4.2. Expense categories
This section looks at expenses by category of regulated activity—partisan advertising, election advertising, partisan activities and election surveys—in the 2019 election to understand how third parties allocated their resources. Three of the main categories (all but election surveys) are umbrellas for many activities, each involving a broad range of expenses. This section also looks at subcategories to identify types of activities and resources that go into carrying them out.
This section does not look at expenses for 2011 and 2015 because only election advertising was regulated and subcategories were not reported.
4.2.1. Expenses by category: all regulated activities
At the 2019 general election, third parties spent close to $11.7 million in total on regulated activities. Of this total, they spent over $3.3 million (29%) on activities in the pre-election period and over $8.3 million (71%) in the election period. This split is disproportionate to the number of days in each period. On average, third parties spent $45,865 per day in the 73-day pre-election period compared with $225,549 per day in the 37-day election period.
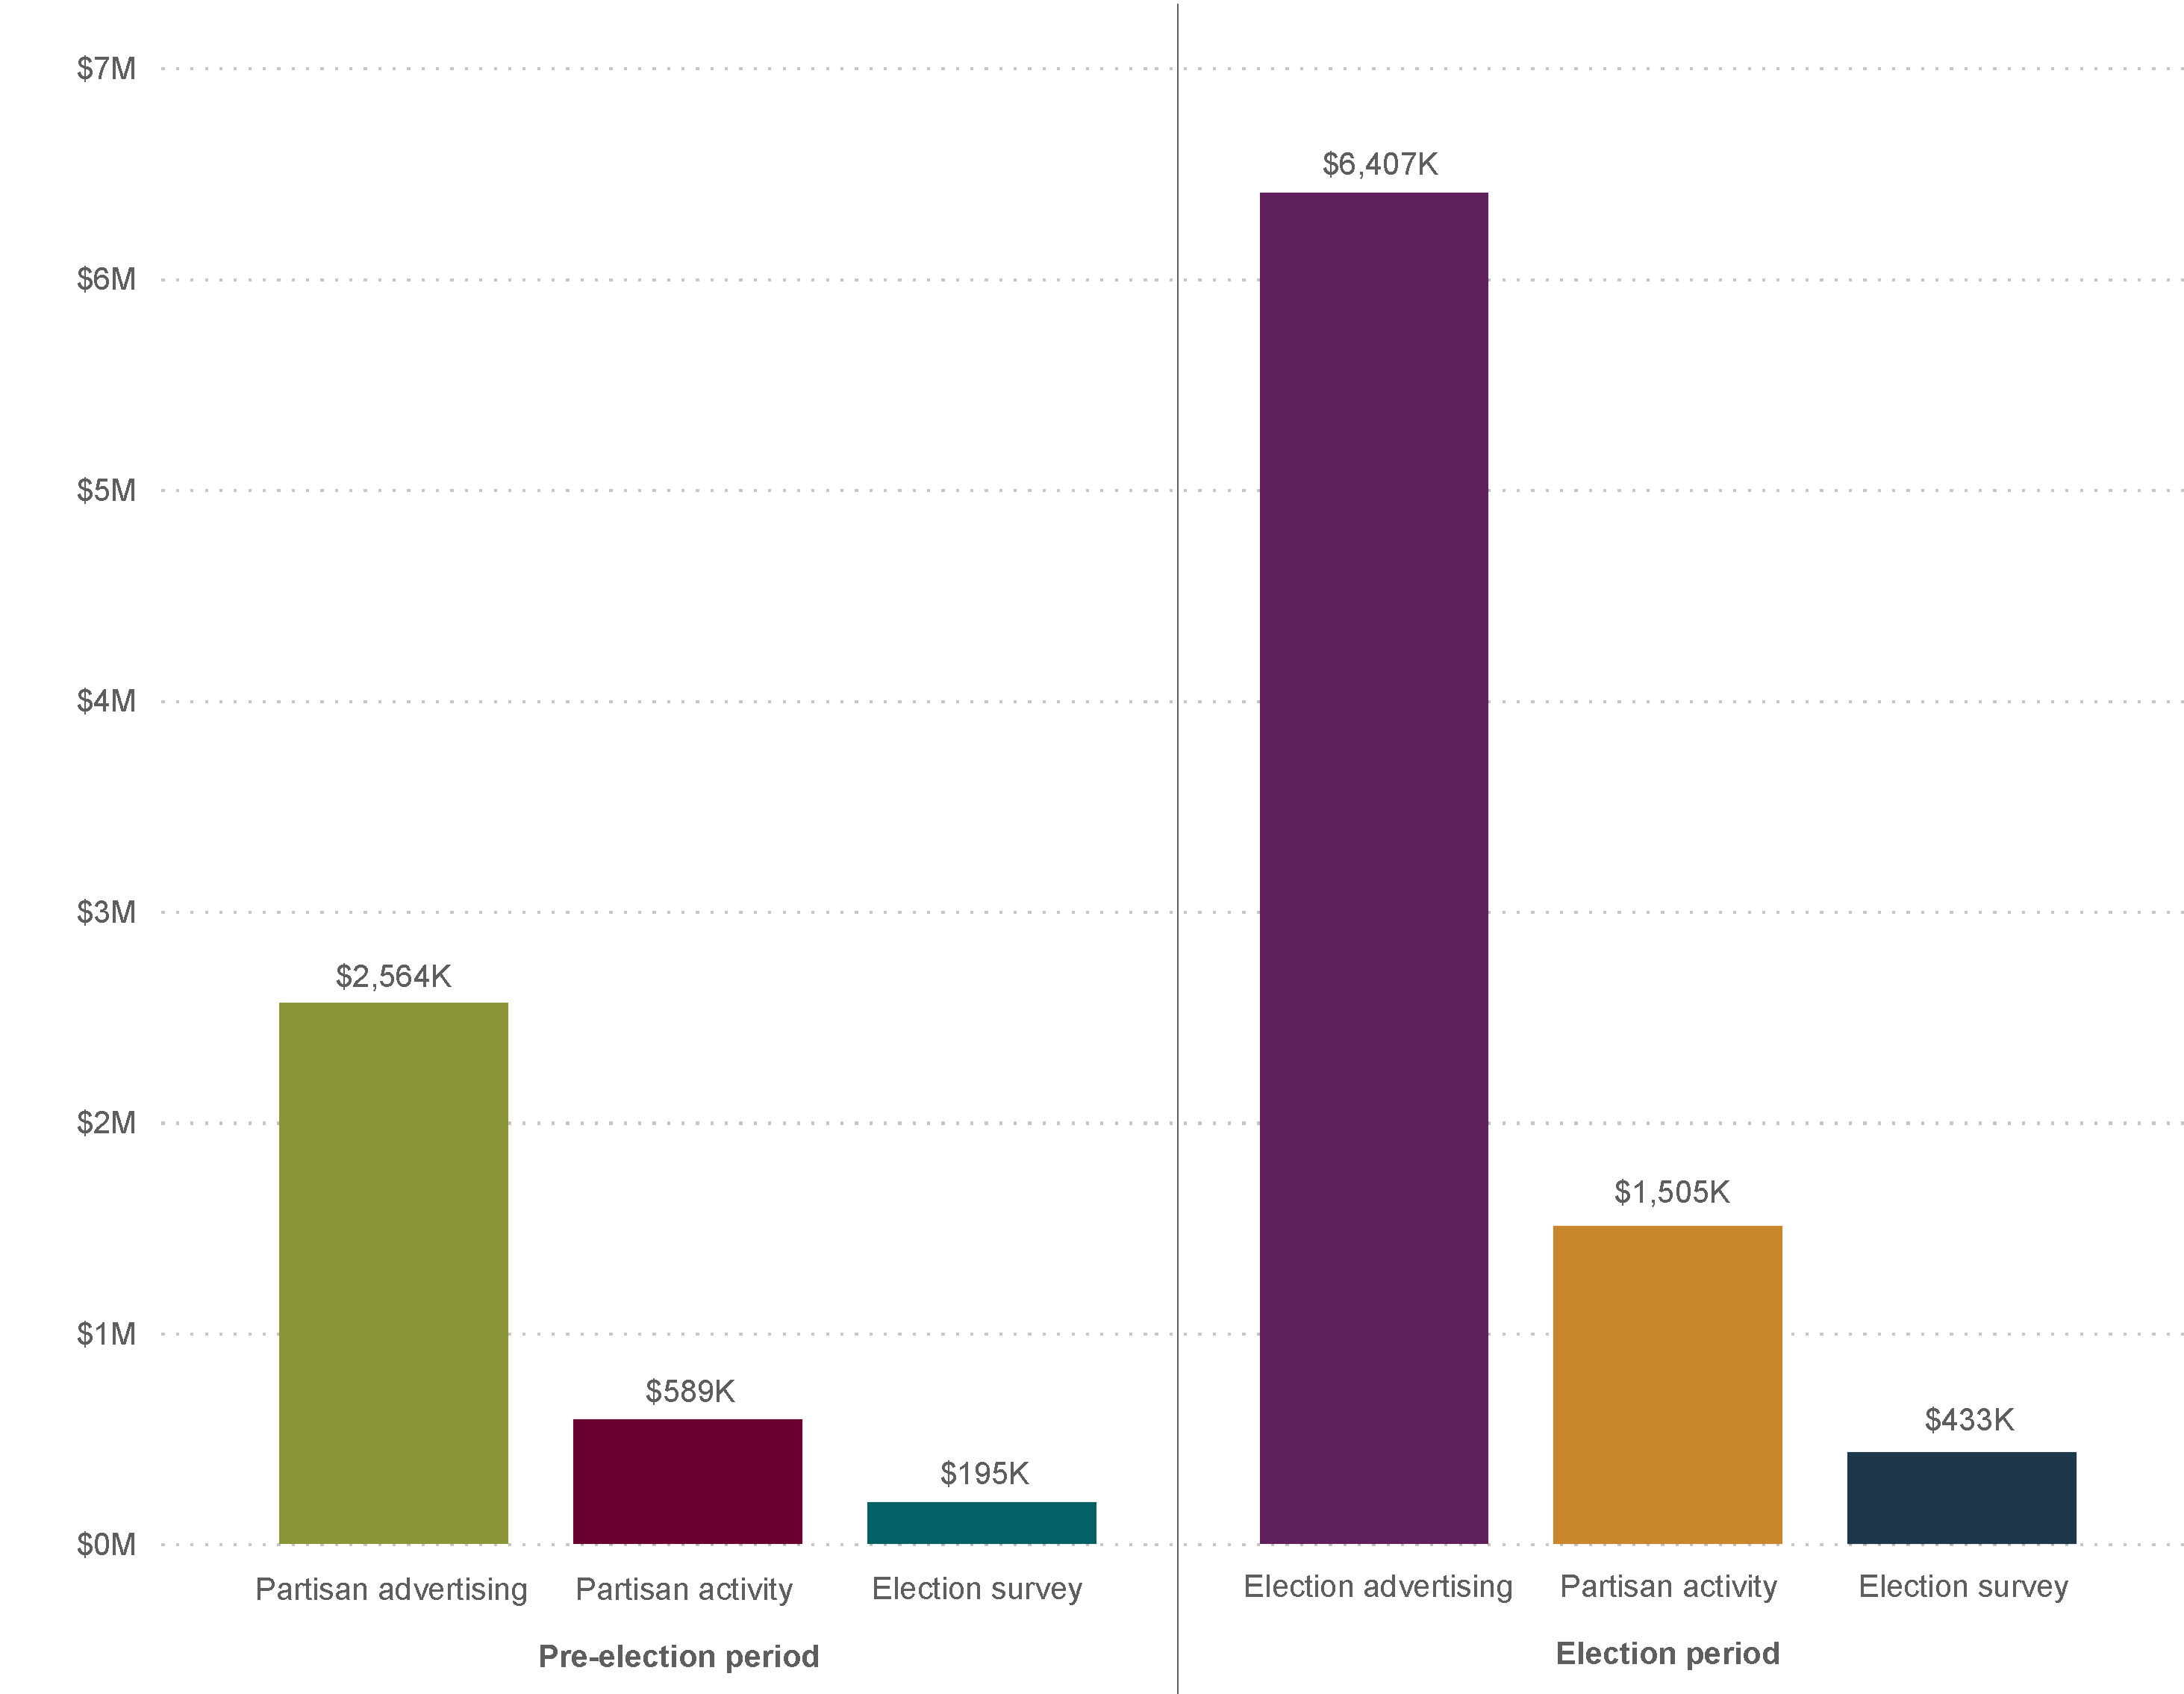
Looking at the four regulated activities, they spent just over $6.4 million on election advertising in the election period (55% of all regulated expenses) and over $2.5 million on partisan advertising in the pre-election period (22%). They spent almost $2.1 million on partisan activities (18%) and close to $630,000 on election surveys (5%) in the two periods.
Figure 6 – Expenses by regulated activity at the 2019 general election (pre-election and election periods)
Text version of "Figure 6 – Expenses by regulated activity at the 2019 general election (pre-election and election periods)"
This bar chart shows total expenses by regulated activity in the pre-election and election periods of the 2019 general election.
For the pre-election period, the breakdown was:
- partisan advertising: $2.56 million
- partisan activities: $589,000
- election surveys: $195,000
For the election period, the breakdown was:
- election advertising: $6.41 million
- partisan activities: $1.50 million
- election surveys: $433,000
4.2.2. Expenses by subcategory: partisan and election advertising
As noted above, partisan advertising and election advertising made up 77% of total third party spending in 2019. Third parties were instructed to report partisan advertising and election advertising expenses, using the following subcategories:
- design and development
- production costs for videos
- placement costsFootnote 13
- content boosting
- social media
- television
- radio
- mailouts
- print media
- signs
- other
A review of the data suggests inconsistencies in reporting among third parties. Some expenses could fit into multiple subcategories, leaving third parties a choice of how to categorize them. At the same time, some subcategories appear to have been interpreted differently among the third parties. This makes it difficult to draw findings about the advertising subcategories.
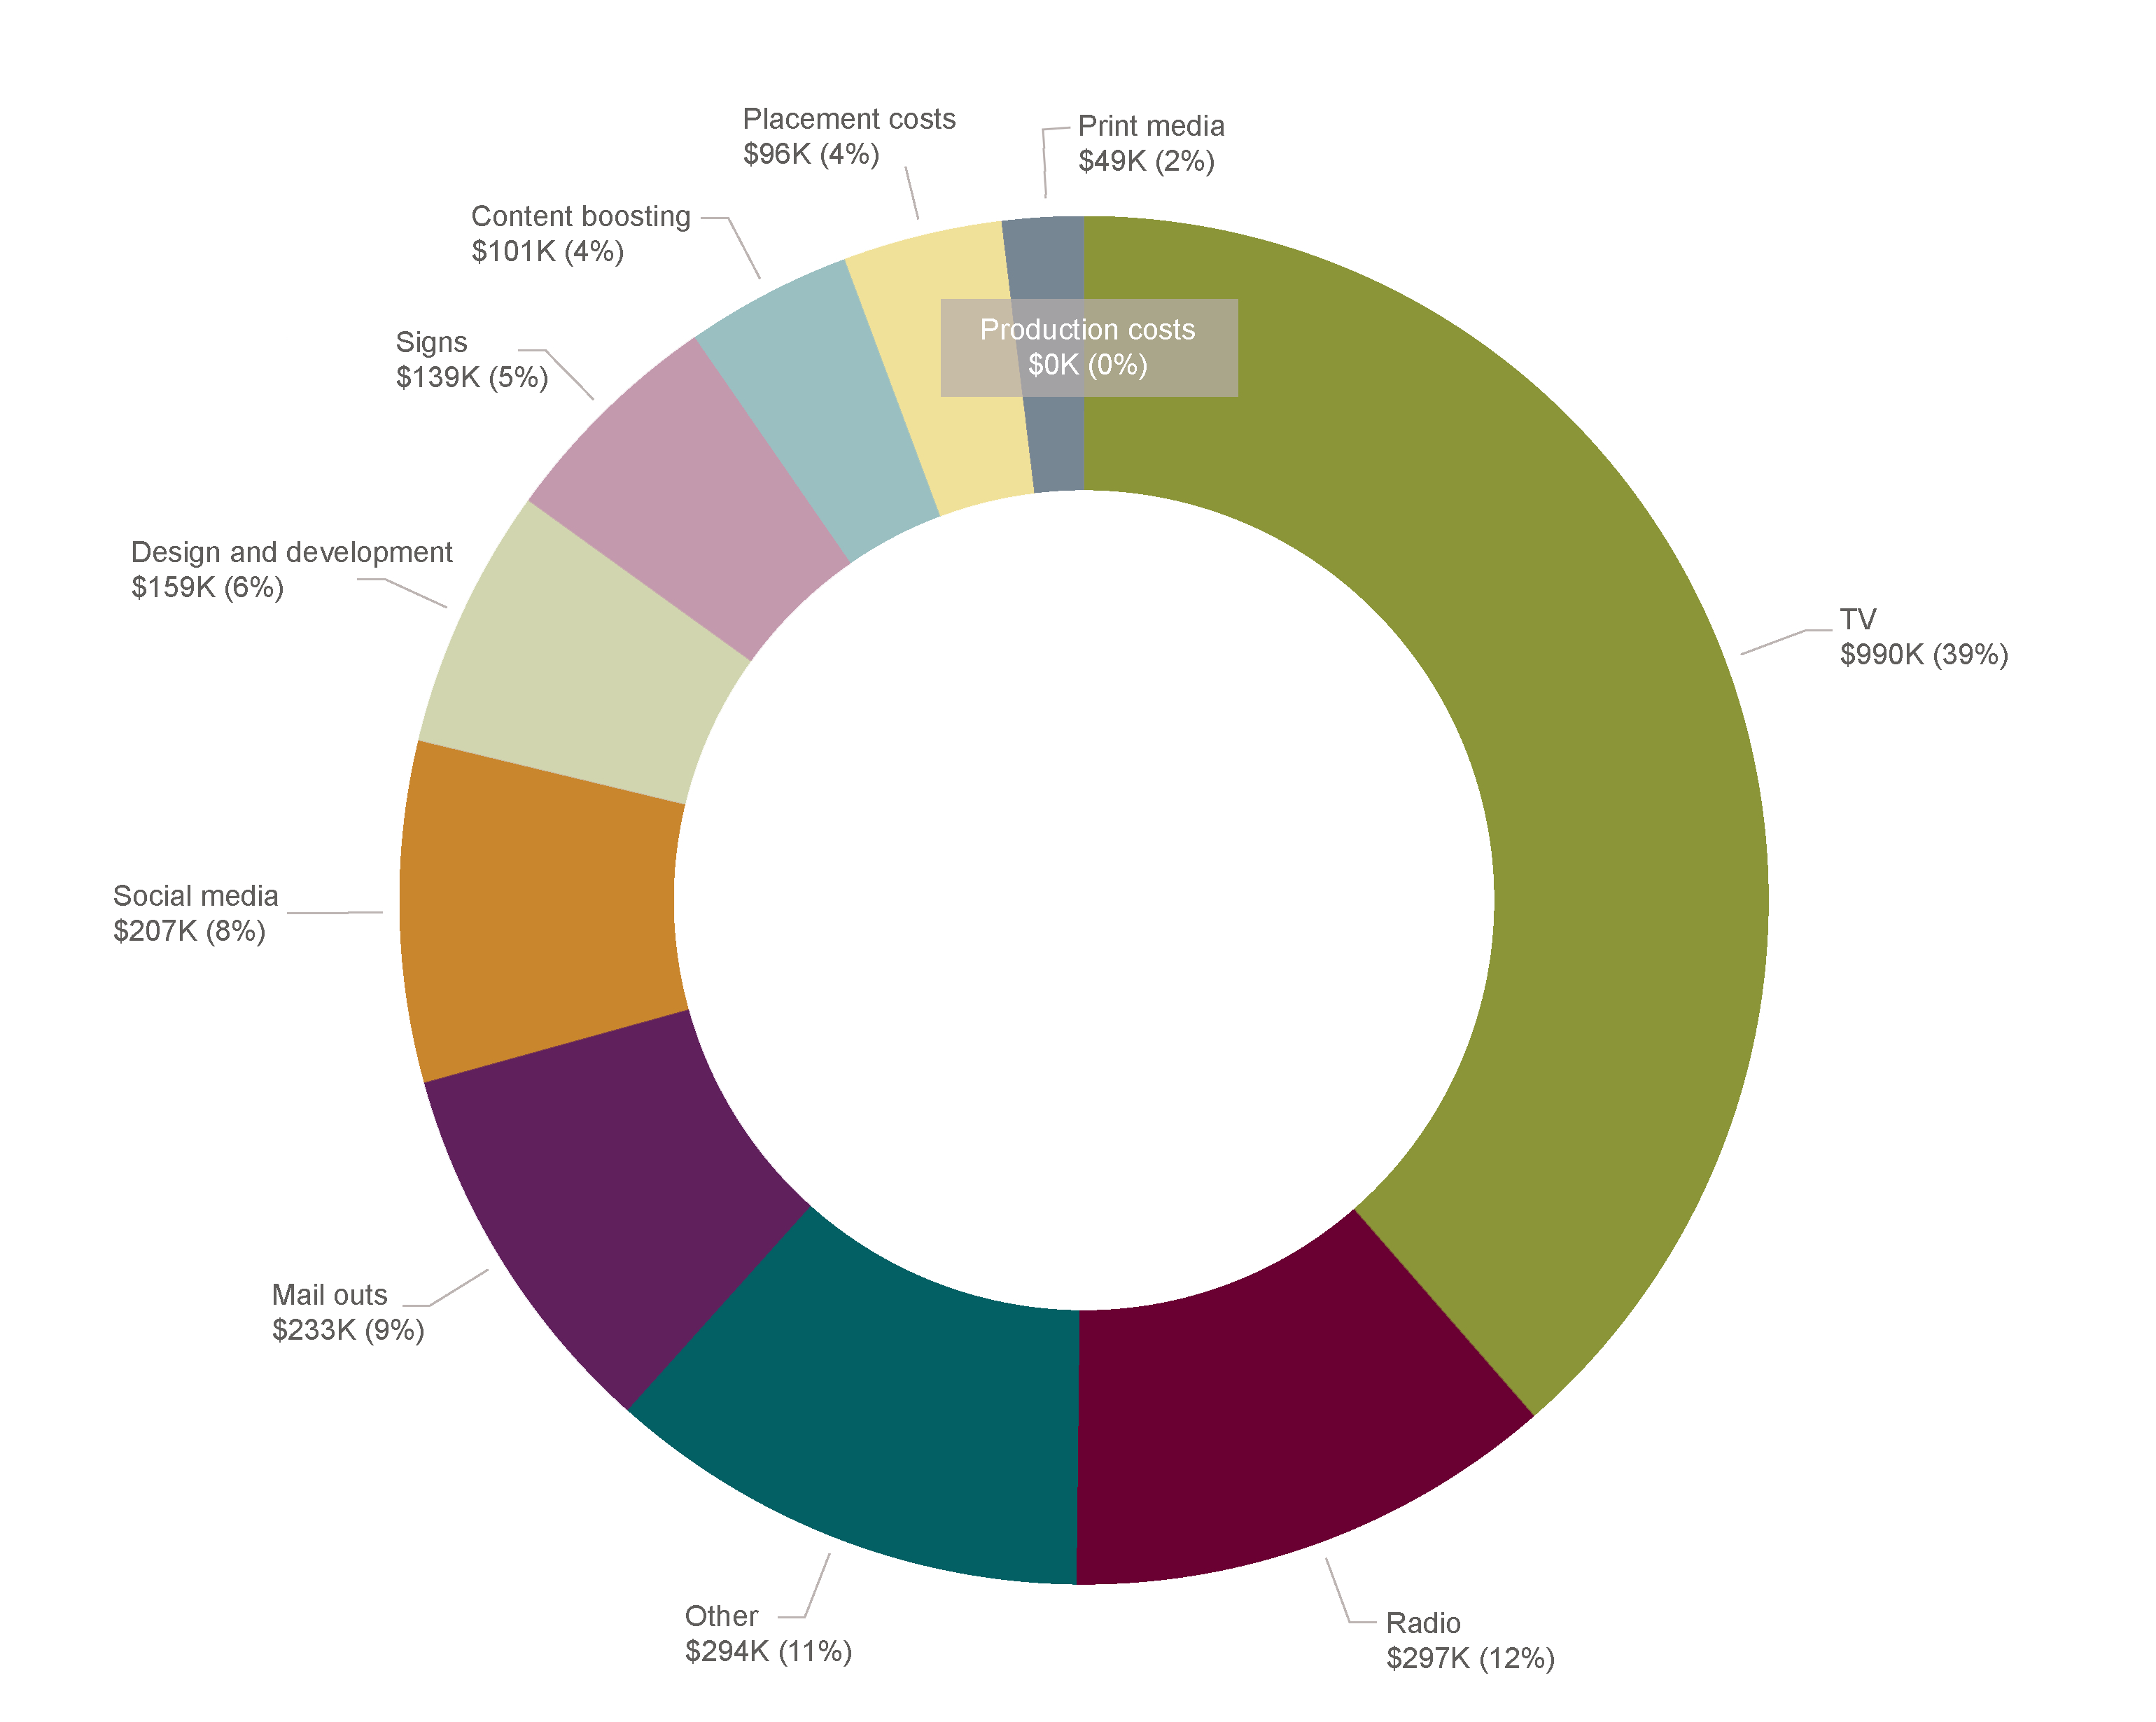
The highest advertising expenditure reported in the pre-election period was conclusively for television (39% of partisan advertising expenses). Social media advertising was likely 12% or more of spending; it was calculated by combining the social media and content boosting subcategories. This was followed by radio at 12% and mailouts at 9%.
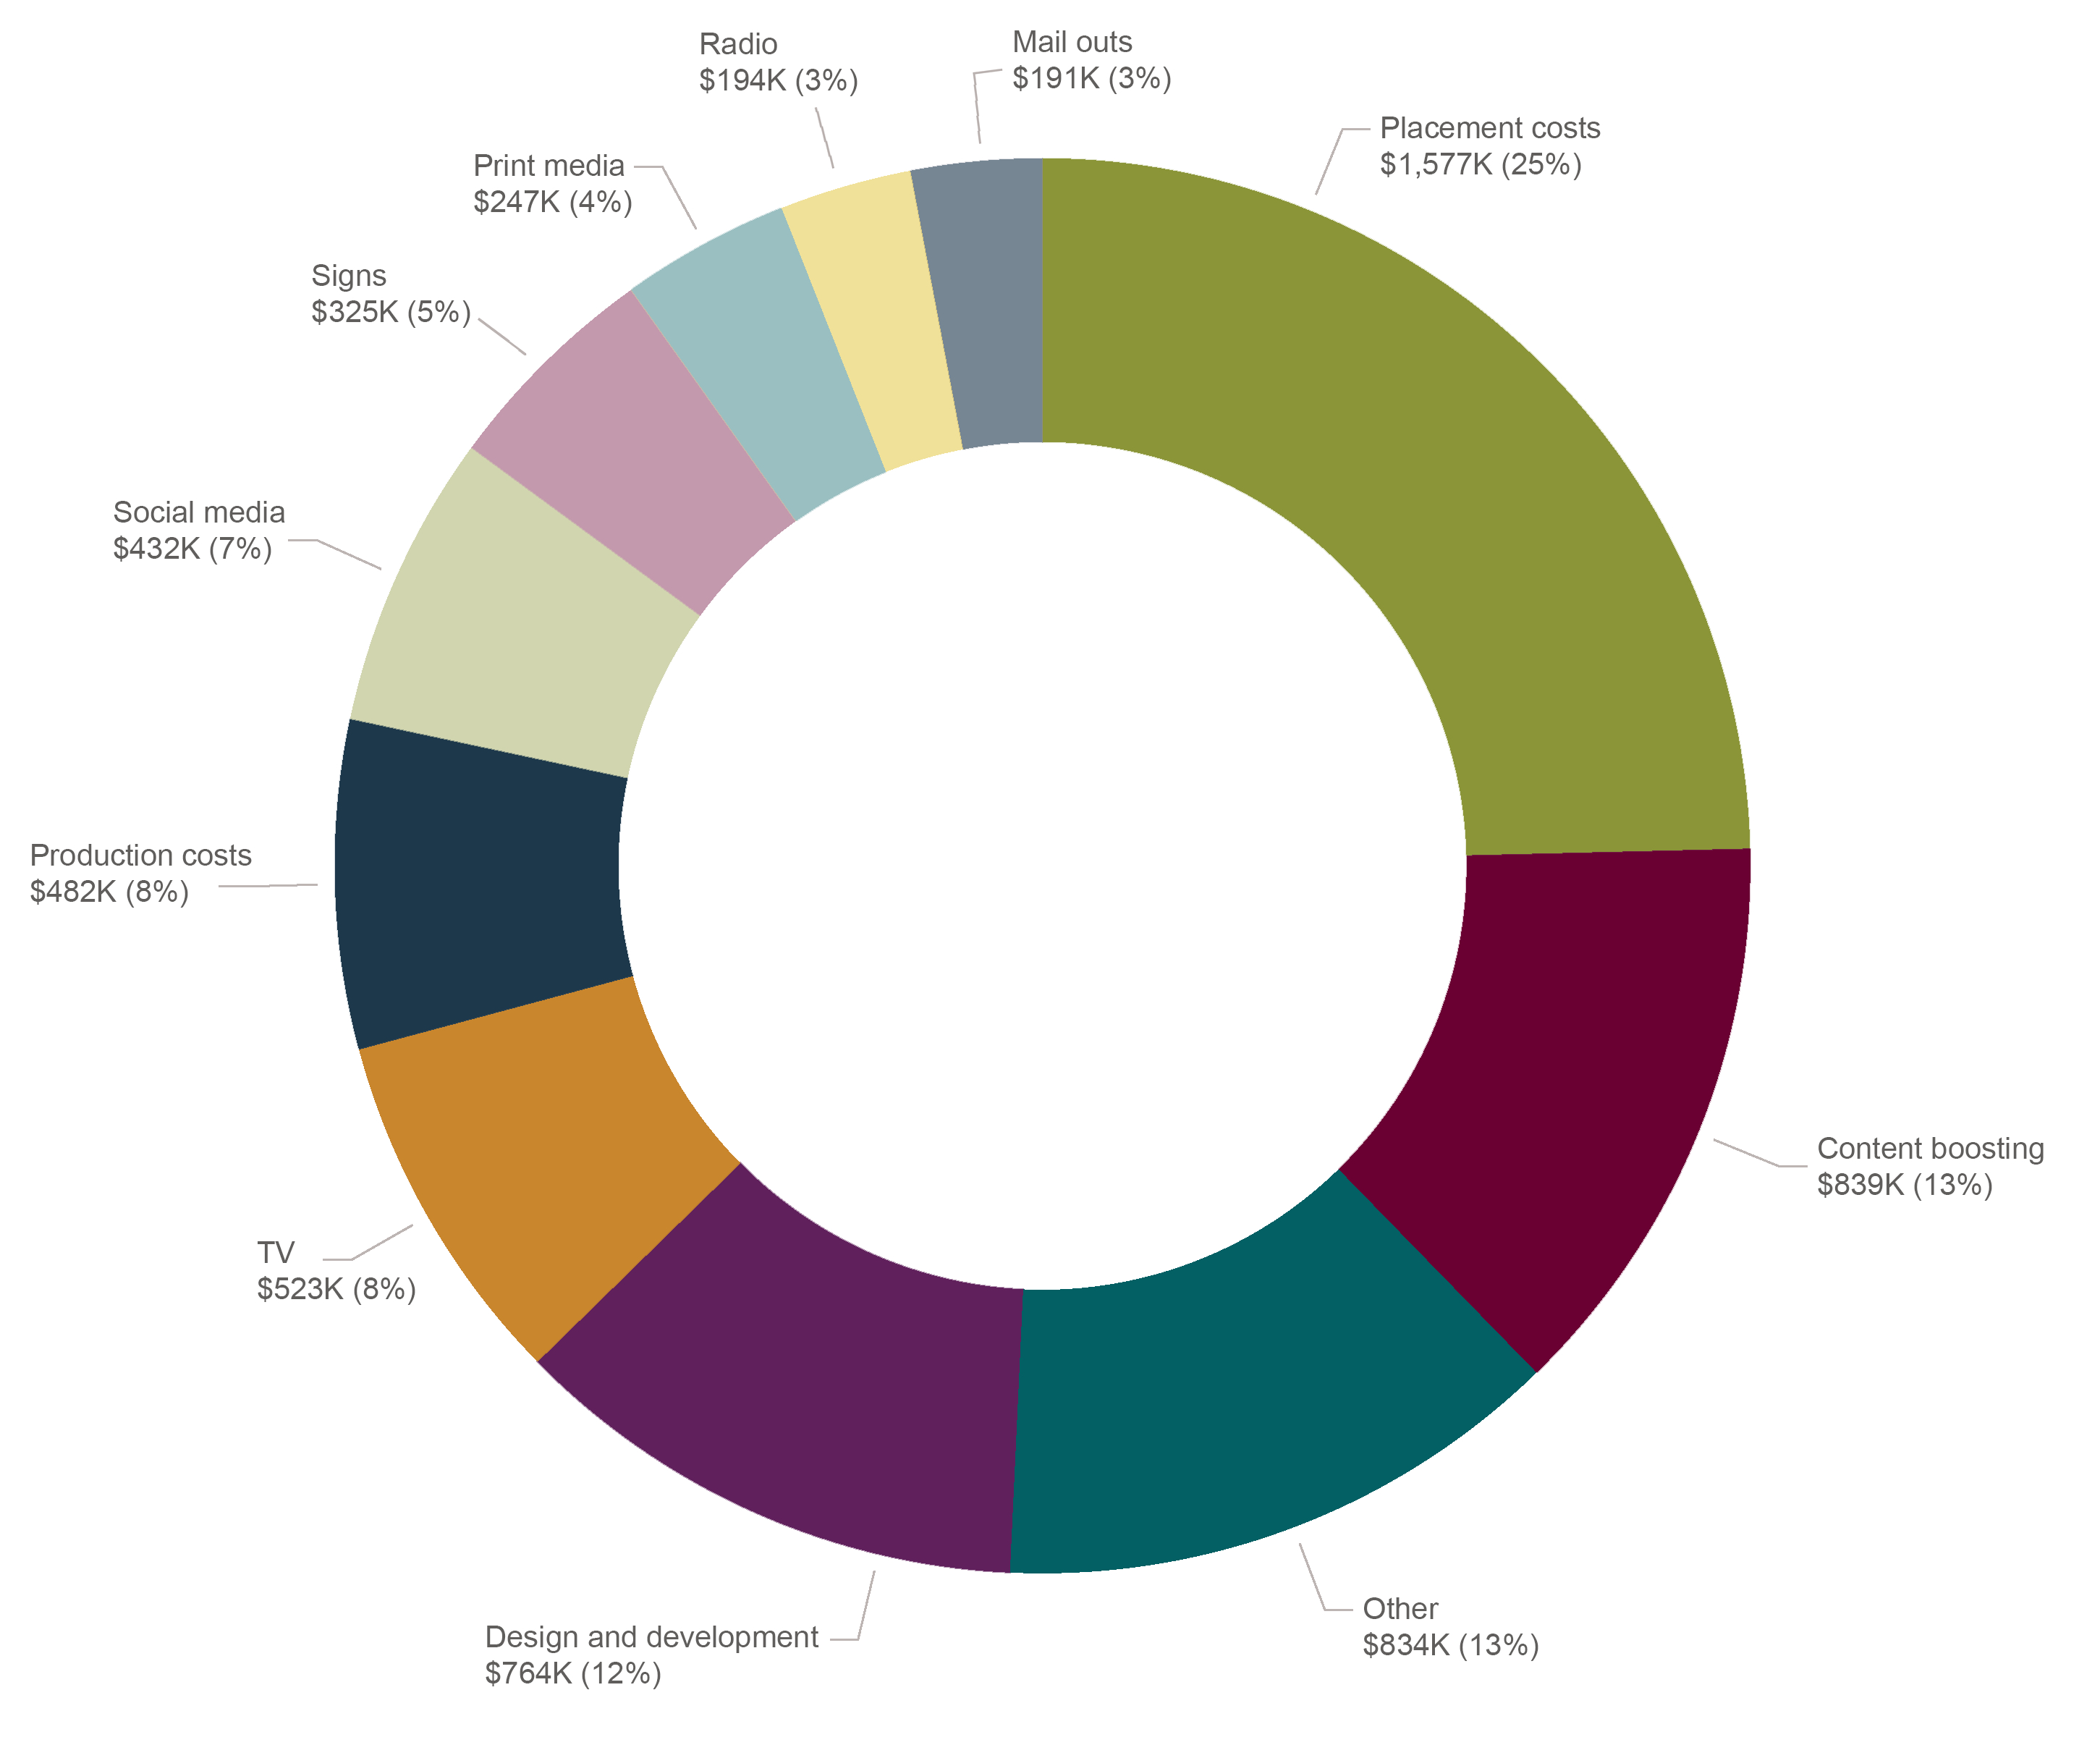
In the election period, the highest expenditure was for placement costs (25% of election advertising expenses). While this subcategory was meant to capture placement costs for media not captured by another subcategory, some third parties used it to report ads in print media and social media and general payments to advertising agencies. Notably, social media advertising rose from at least 12% to at least 20% of spending. Television expenses dropped from 39% to 8% of advertising expenses in the election period. This may indicate a shift away from television ads closer to election day; but it may also indicate that television ad space was categorized as a placement cost. All other media made up 3% to 5% of advertising expenses in the election period.
Figure 7 – Partisan advertising expenses by subcategory at the 2019 general election
Text version of "Figure 7 – Partisan advertising expenses by subcategory at the 2019 general election"
This donut chart shows a breakdown of partisan advertising expenses at the 2019 general election. It provides the dollar amount and percentage of total partisan advertising expenses by subcategory, as follows:
- television: $990,000 or 39%
- radio: $297,000 or 12%
- other: $294,000 or 11%
- mailouts: $233,000 or 9%
- social media: $207,000 or 8%
- design and development: $159,000 or 6%
- signs: $139,000 or 5%
- content boosting: $101,000 or 4%
- placement costs: $96,000 or 4%
- print media: $49,000 or 2%
- production costs: $150 or 0%
Figure 8 – Election advertising expenses by subcategory at the 2019 general election
Text version of "Figure 8 – Election advertising expenses by subcategory at the 2019 general election"
This donut chart shows a breakdown of election advertising expenses at the 2019 general election. It provides the dollar amount and percentage of total election advertising expenses by subcategory, as follows:
- placement costs: $1.58 million or 25%
- content boosting: $839,000 or 13%
- other: $834,000 or 13%
- design and development: $764,000 or 12%
- television: $523,000 or 8%
- production costs: $482,000 or 8%
- social media: $432,000 or 7%
- signs: $325,000 or 5%
- print media: $247,000 or 4%
- radio: $194,000 or 3%
- mailouts: $191,000 or 3%
4.2.3. Expenses by subcategory: partisan activities
As noted above, partisan activities in the pre-election and election periods made up 18% of total third party spending in 2019. Third parties were instructed to report expenses for partisan activities in the following subcategories:
- salaries, wages and consulting fees
- voter contact (calling services, text messaging, database updates, etc.)
- social media (design and maintenance)
- office (furniture, software, supplies, rent, utilities, website, etc.)
- events (non-ticketed fundraising events, kick-off meetings, rallies, etc.)
- canvassing (remuneration, transportation, etc.)
- other expenses (bank fees, interest, transaction fees, meals, entertainment, etc.)
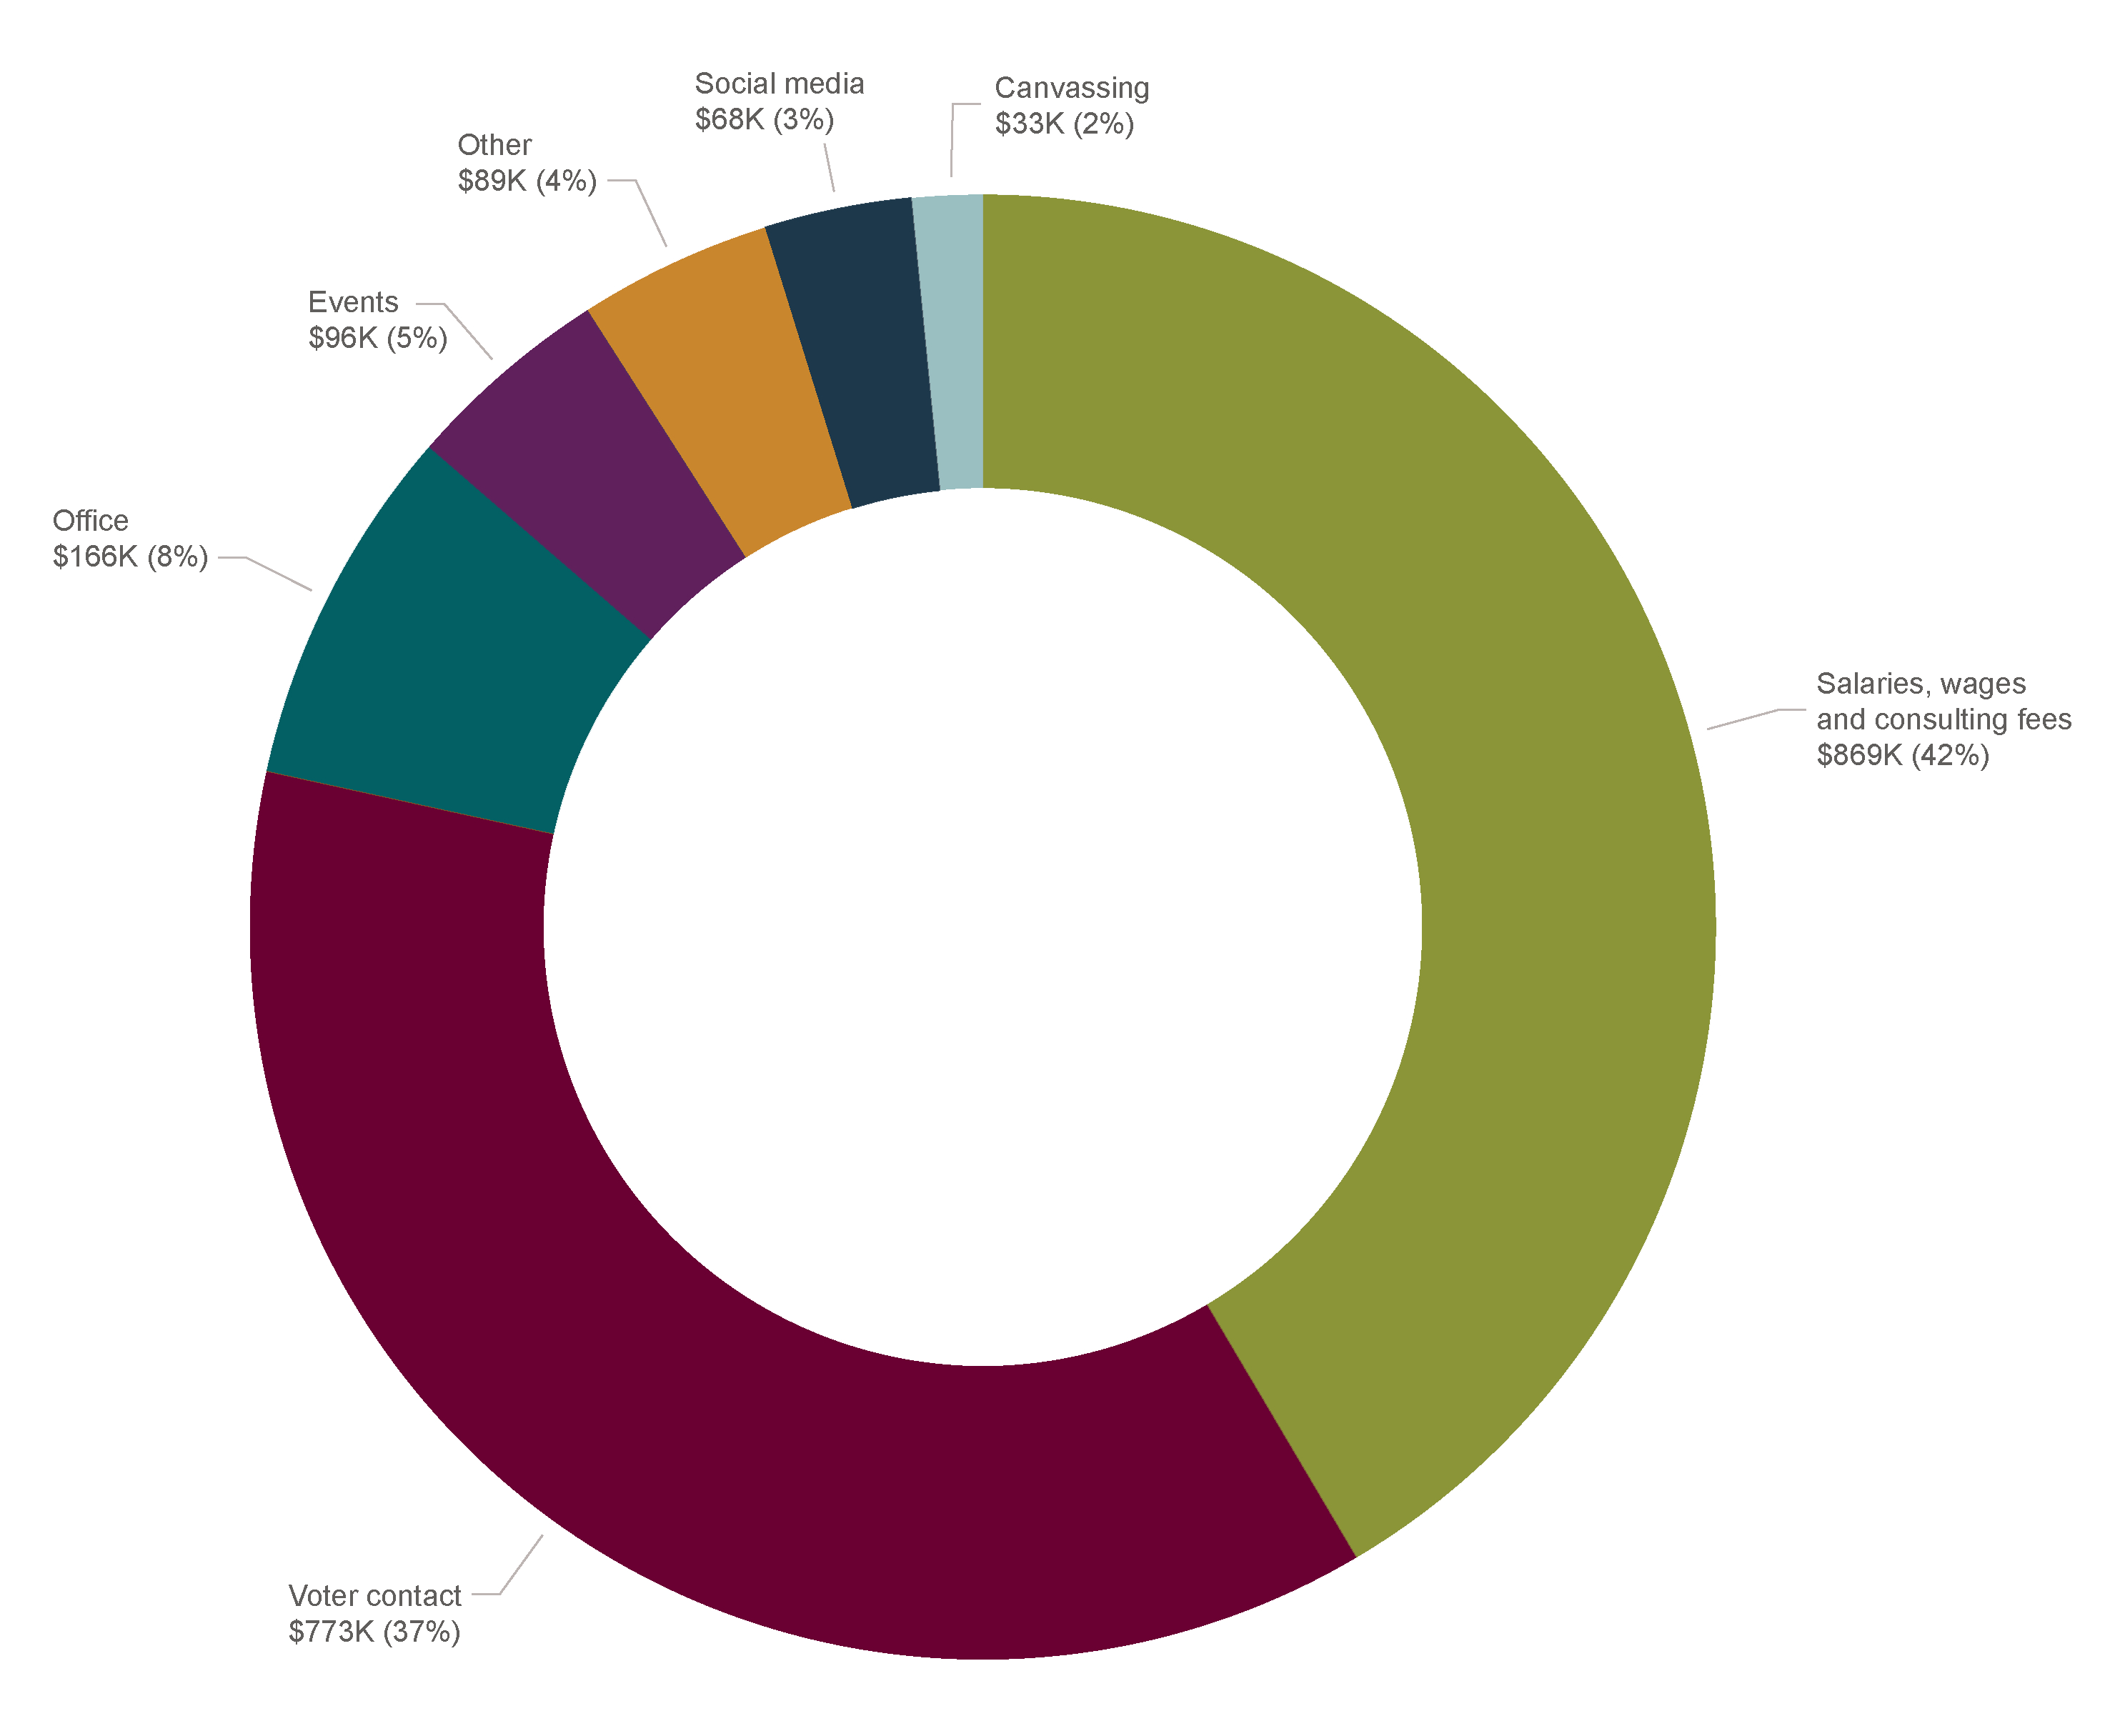
The highest partisan activity expenditure was for salaries, wages and consulting fees (42% of partisan activity expenses). Voter contact was a close second at 37%. Other activities drew lower spending. Office expenses were 8%, in-person campaigning (a combination of canvassing and events) was 6% and social media (other than advertising) was 3% of spending on partisan activities.
Figure 9 – Partisan activity expenses by subcategory at the 2019 general election
Text version of "Figure 9 – Partisan activity expenses by subcategory at the 2019 general election"
This donut chart shows a breakdown of partisan activity expenses at the 2019 general election. It provides the dollar amount and percentage of total partisan activity expenses by subcategory, as follows:
- salaries, wages and consulting fees: $869,000 or 42%
- voter contact: $773,000 or 37%
- office: $166,000 or 8%
- events: $96,000 or 5%
- other: $89,000 or 4%
- social media: $68,000 or 3%
- canvassing: $33,000 or 2%
4.3. Key findings from this chapter
- Total spending and average spending per third party increased in every general election from 2011 to 2019. However, a clear trend cannot be established because of varied election period lengths and regulated activities.
- In election periods from 2011 to 2019, the majority of third parties (84% to 86%) consistently spent 25% or less of the spending limit, while a small minority (4%) spent 75% or more. Only labour organizations, corporations and groups with a governing body reached the top spending tier.
- In the 2019 pre-election period, generally, third parties spent well below the limit. Only 2% of third parties spent more than 25% of the limit.
- Some 71% of third party spending in 2019 went toward regulated activities in the election period, despite the pre-election period being twice as long.
- Partisan advertising and election advertising made up the bulk of third party expenses in 2019, accounting for 77% of all spending. Television and social media claimed the highest shares of advertising expenses.
Footnotes
Return to source of footnote 11 International Union of Operating Engineers. Local 793. (2015). Locals stepping up political action. https://iuoelocal793.org/locals-stepping-up-political-action/
Return to source of footnote 12 See the relationship between the Canadian Labour Congress and Fairness Works at http://fairnessworks.ca. See the relationship between Let's Build Canada and Canada's Building Trade Unions in Let's Build Canada, n.d., About at https://www.letsbuildcanada.ca/about.
Return to source of footnote 13 A placement cost is a fee that a publisher or other provider charges for advertising space. It excludes design or production costs. It also excludes a third party's own website costs.