 Site Menu
3. Financial Administration – Funding – Third Party Report – A Comparative Look at Third Party Information from the 2011, 2015 and 2019 Federal General Elections
A third party funds its expenses for regulated activities from various sources: contributions, its own resources and loans. This chapter uses data provided by third parties in their electoral campaign returns for the 2011 to 2019 general elections to understand the main sources of funding, who made and received contributions, and the extent to which third parties relied on their own resources to carry out activities.
3.1. Comparison of funding sources
In comparing sources of funding used by third parties at the 2011, 2015 and 2019 general elections, contributions emerge as the main source, followed by third parties' own resources, then loans.
The total amount of contributions received for the 2011 election was just over $2.0 million. This climbed to over $4.8 million for the 2015 election and reached $7.2 million for the 2019 election. While the dollar value of contributions continually increased, contributions as a share of total funding decreased over time, from 92% of total funding in 2011 to 74% in 2015 and 63% in 2019.
Third parties used roughly $180,000 of their own resources for the 2011 election, about $1.7 million for the 2015 election and about $4.3 million for the 2019 election. A third party's own resources were the fastest-growing source of funding, with their share of total funding increasing from 8% in 2011 to 26% in 2015 and 37% in 2019.
Loans were a comparatively minor source of funding at each election. Third parties obtained loans amounting to about $2,000 for the 2011 election, $30,000 for the 2015 election and $5,000 for the 2019 election to fund their regulated activities.
The remainder of this chapter looks in detail at contributions and a third party's own resources as sources of funding.
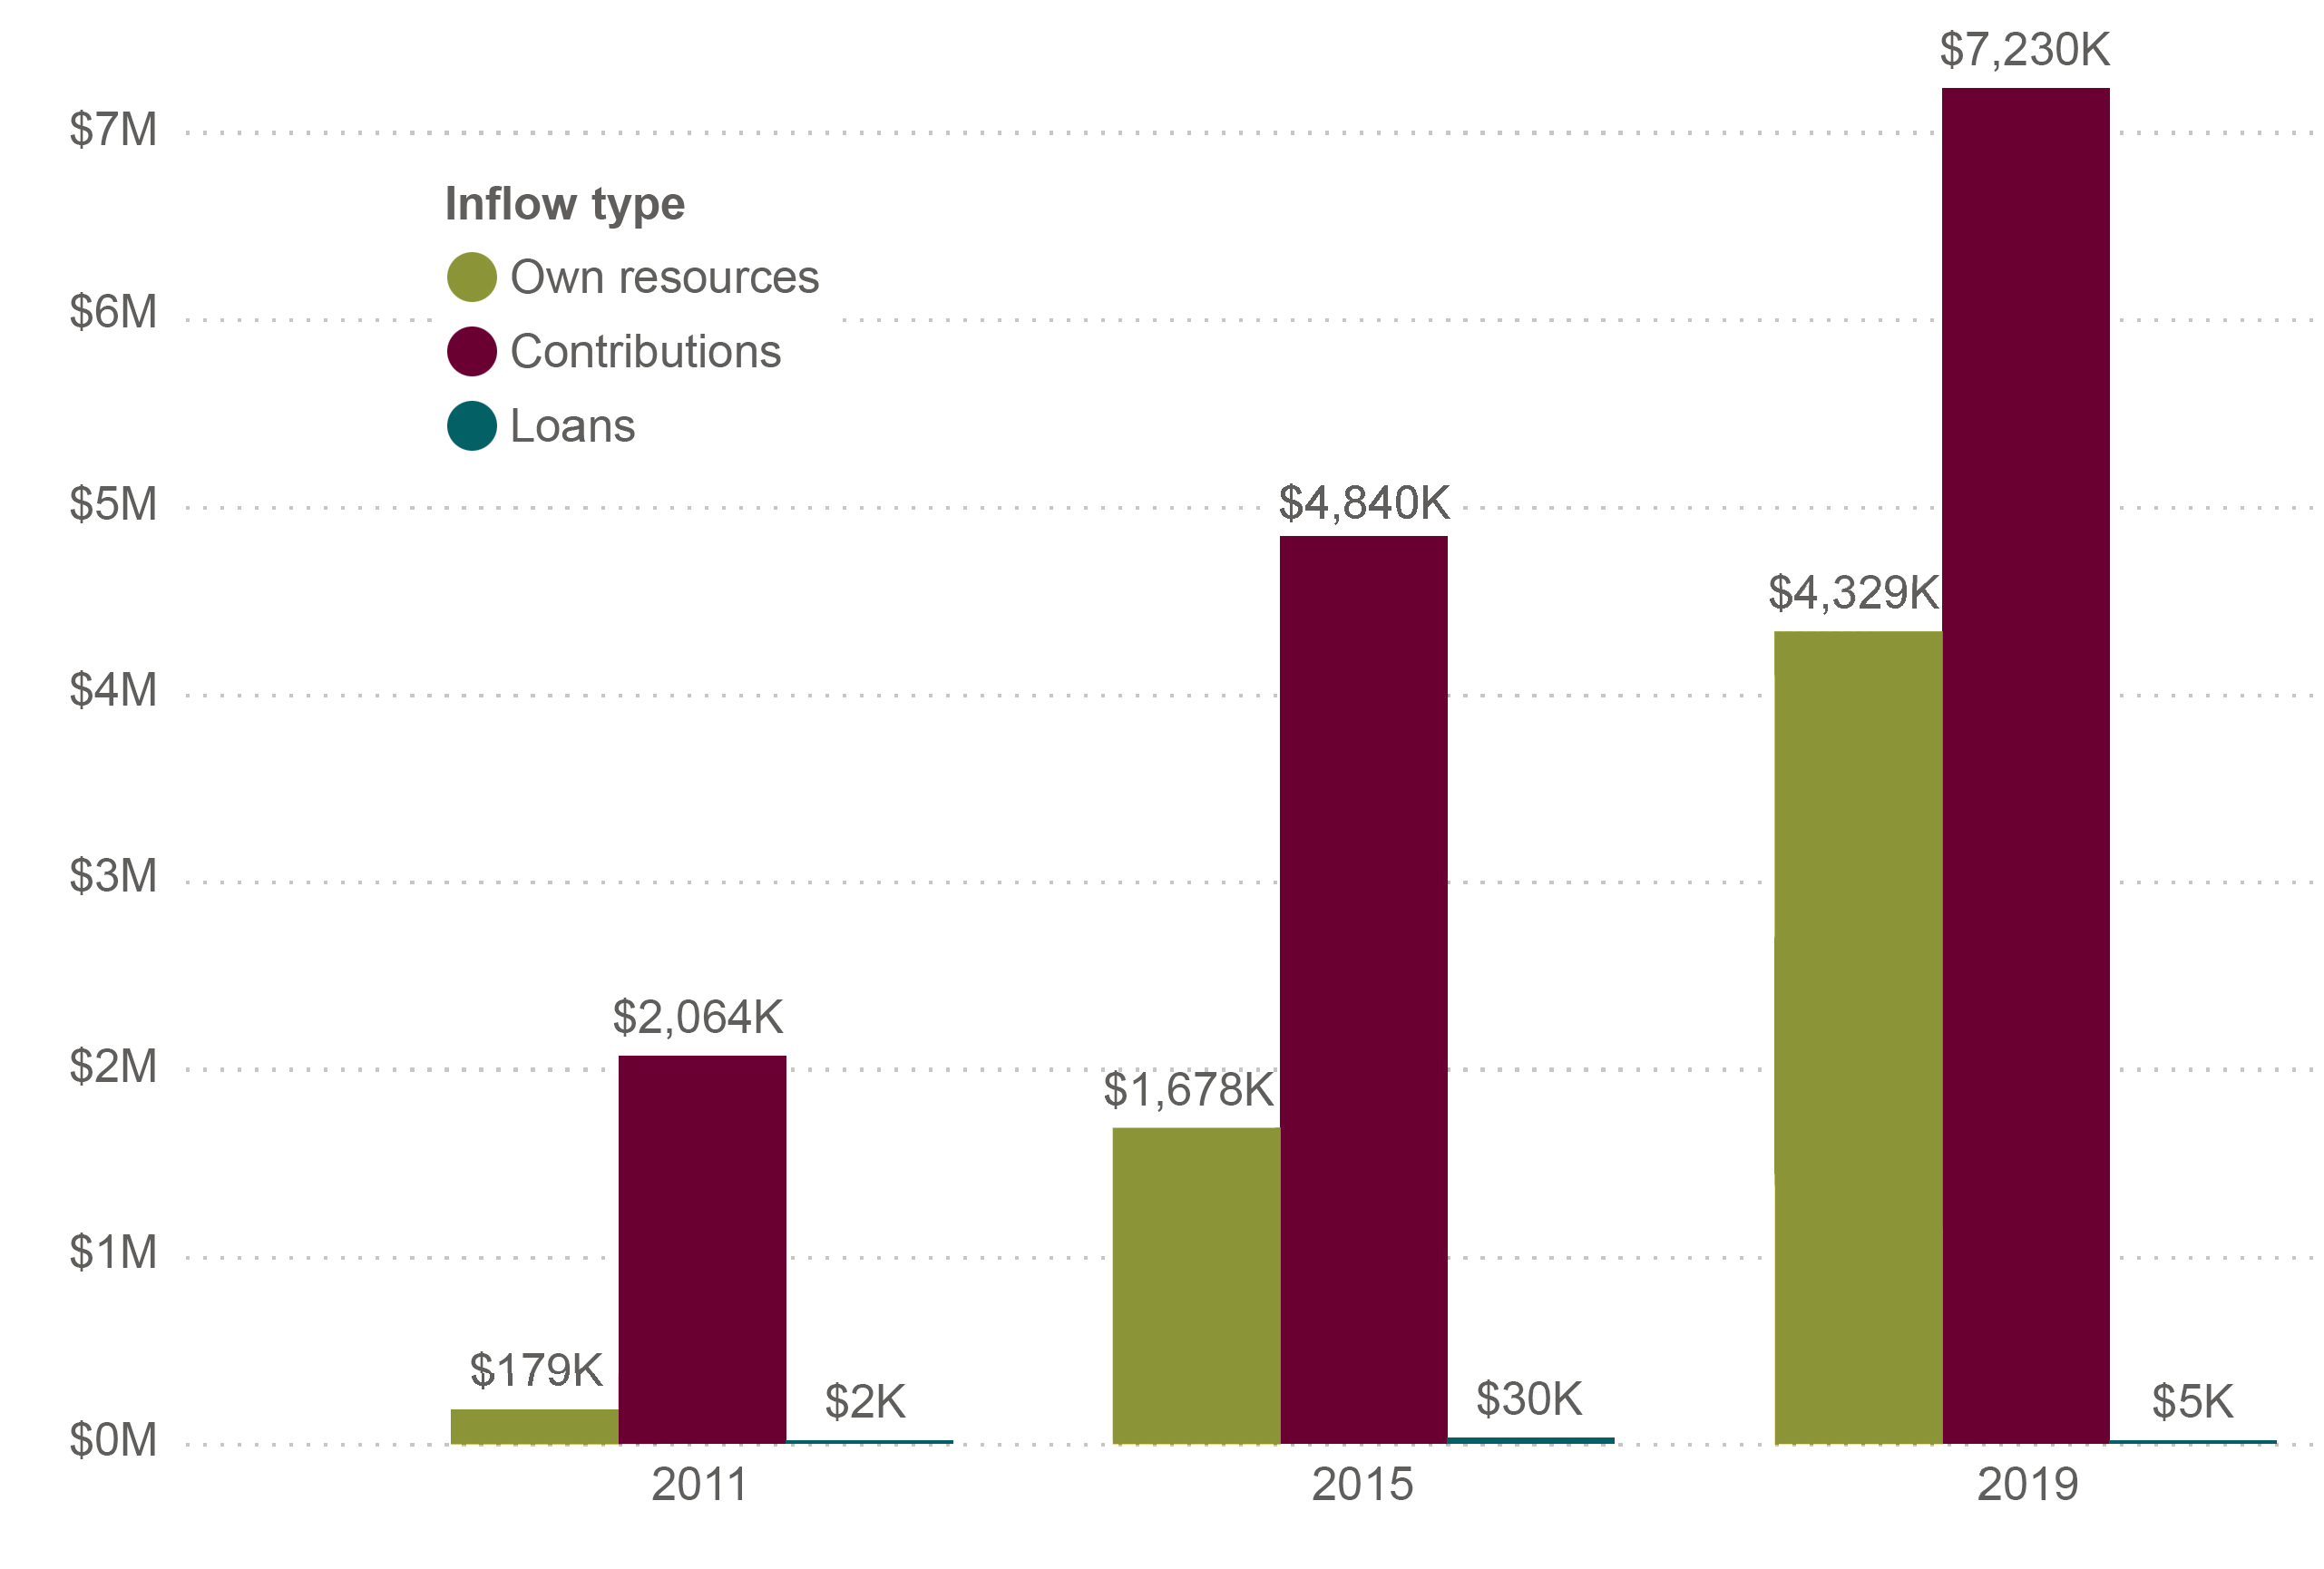
Figure 2 – Distribution of funding between contributions, third parties' own resources, and loans at the 2011, 2015 and 2019 general elections
Text version of "Figure 2 – Distribution of funding between contributions, third parties' own resources, and loans at the 2011, 2015 and 2019 general elections"
This bar chart shows the distribution of funding between contributions, third parties' own resources and loans at three general elections.
For 2011, the breakdown was:
- own resources: $179,000
- contributions: $2.06 million
- loans: $2,000
For 2015, the breakdown was:
- own resources: $1.68 million
- contributions: $4.84 million
- loans: $30,000
For 2019, the breakdown was:
- own resources: $4.33 million
- contributions: $7.23 million
- loans: $5,000
3.2. Contributions
Third parties can accept contributions from a variety of sources. Unlike registered political parties and their affiliated entities that can accept limited contributions only from Canadian citizens or permanent residents, third parties can accept unlimited contributions from those individuals and from businesses and organizations that operate in Canada. A third party cannot use funds from a foreign entity to pay for regulated activities.
Contributions received for regulated activities must be reported in the third party's financial returns. Before 2019, third parties had to report contributions received only as far back as six months before the election was called. Starting in 2019, the reporting period extended back to the previous general election.
The level of detail to report varies by contribution amount. When total contributions from a single contributor are more than $200, the contributor's name and address are disclosed in the financial returns. Contributions of $200 or less are aggregated and reported by contributor type, along with the number of contributors. There is no location data available for contributions of $200 or less.
If a third party has received some contributions for regulated activities and some for other purposes but is not able to tell them apart, it must report the name and address of every contributor who made contributions totalling more than $200 for any purpose. As a result, some contributions are included in this report, although they may not in fact have been made or used for the third party's regulated activities.
3.2.1. Total contributions and contributors
Total contributions reported by third parties steadily increased for each general election from 2011 to 2019. They went from $2.0 million for the 2011 election to $4.8 million for the 2015 election (an increase of 134%) and $7.2 million for the 2019 election (a further increase of 49%). The same trend can be observed when looking at the average contribution. It was $74 for 2011, $150 for 2015 (an increase of 103%) and $212 for 2019 (a further increase of 42%). Median contributions increased more slowly. Among contributors who gave more than $200, the median contribution was $290 for 2011, $328 for 2015 (an increase of 13%) and $400 for 2019 (a further increase of 22%).
The total number of third party contributors also increased slowly over time. There were approximately 28,000 contributors for the 2011 election, 32,000 for the 2015 election and 34,000 for the 2019 election.
| Election | Total contributions | Total contributors | Average contribution |
|---|---|---|---|
| 2011 | $2,064,206 | 28,082 | $74 |
| 2015 | $4,839,553 | 32,359 | $150 |
| 2019 | $7,229,509 | 34,063 | $212 |
3.2.2. Contributions by contributor type
Third parties are required to report the contributions they receive for regulated activities by contributor type, as set out in the law. The contributor types are:
- individuals
- businesses
- governments
- trade unions
- corporations (without share capital)
- unincorporated associations
Individuals made up the vast majority of third party contributors from 2011 to 2019, making about 93,900 of 94,500 contributions. At each election, there was an increase in the number of contributors among most contributor types. The exceptions were trade unions, whose number of contributors was highest in 2015, and governments, from whom no contributions were reported at any election.
| Election | Individual | Trade union | Business | Unincorporated association | Corporation - no shares | Total contributors |
|---|---|---|---|---|---|---|
| 2011 | 28,048 | 12 | 6 | 16 | 0 | 28,082 |
| 2015 | 32,204 | 67 | 48 | 21 | 19 | 32,359 |
| 2019 | 33,613 | 47 | 341 | 30 | 32 | 34,063 |
| Total | 93,865 | 126 | 395 | 67 | 51 | 94,504 |
In dollar amounts, total contributions from individuals surpassed those of other contributor types, rising from $2.0 million for the 2011 election to $3.0 million for the 2019 election. Trade unions were the second-biggest donors. In 2015, their total contributions of $2.1 million came close to the $2.4 million in contributions from individuals. However, the gap widened again in 2019, even though contributions from trade unions continued to increase.
Other contributor types played a comparatively small role in financing third parties—except for businesses and corporations without share capital in the 2019 election, whose total contributions reached over $1.1 million and $500,000, respectively.
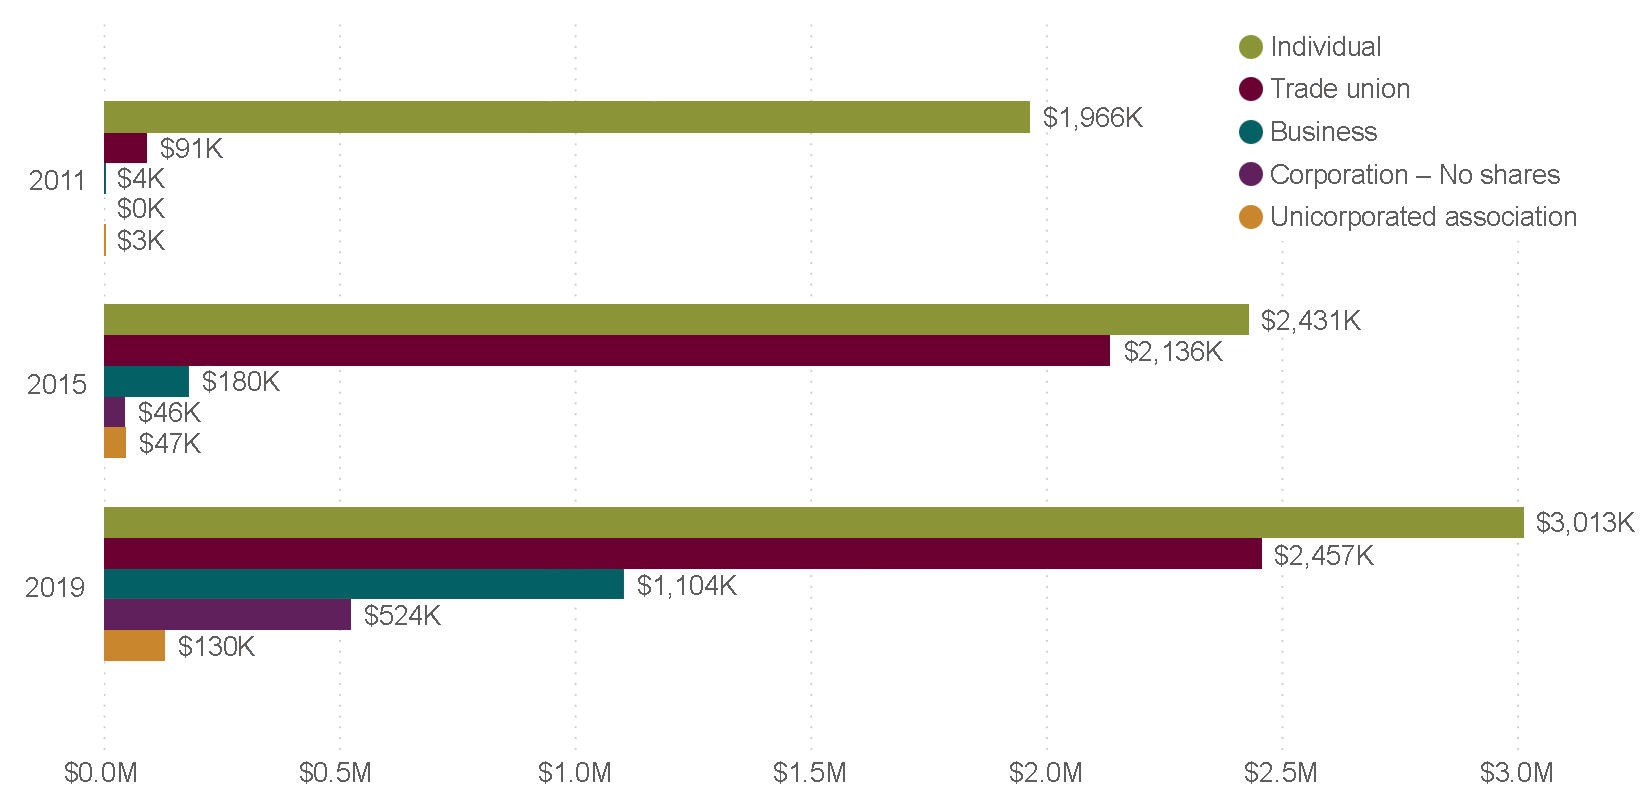
Figure 3 – Total contributions by contributor type at the 2011, 2015 and 2019 general elections
Text version of "Figure 3 – Total contributions by contributor type at the 2011, 2015 and 2019 general elections"
This bar chart shows total contributions by contributor type at three general elections, as follows:
- individuals: $1.97 million in 2011, $2.43 million in 2015, $3.01 million in 2019
- trade unions: $91,000 in 2011, $2.14 million in 2015, $2.46 million in 2019
- businesses: $4,000 in 2011, $180,000 in 2015, $1.10 million in 2019
- corporations with no shares: $0 in 2011, $46,000 in 2015, $524,000 in 2019
- unincorporated associations: $3,000 in 2011, $47,000 in 2015, $130,000 in 2019
As Table 2 shows, the average contribution in each election was below or around $200. Third parties report contributions of $200 or less in the aggregate by contributor type. Contributions in this category remained relatively stable from the 2011 to 2019 elections, around $1.4 million. Across the three elections, 95% of all contributors gave contributions of $200 or less. The highest total contributions of $200 or less came from individuals. Among the other contributor types, only businesses gave more than $1,000 in aggregate contributions for any election.
| Election | Number of contributors | Individual | Business | Government | Trade union | Corporation – no shares | Unincorpo-rated association | Total |
|---|---|---|---|---|---|---|---|---|
| 2011 | 27,167 | $1,444,725 | $169 | $0 | $0 | $0 | $752 | $1,445,646 |
| 2015 | 30,736 | $1,528,258 | $531 | $0 | $250 | $0 | $985 | $1,530,024 |
| 2019 | 31,754 | $1,354,256 | $10,076 | $0 | $55 | $494 | $600 | $1,365,481 |
3.2.3. Contributions by top contributors
At the other end of the spectrum, the highest contributions to third parties ranged in the ten thousands for the 2011 election to the hundreds of thousands for the 2015 and 2019 elections. For 2011, many of the highest contributions were from individuals to an advocacy group in Alberta. Other top contributions were from trade unions to an advocacy group in Quebec that was partnered with labour organizations.Footnote 3 The highest contribution for this election was $10,500.
For the 2015 election, the top contributions were all from trade unions. All but one went from a particular trade union's locals to a not-for-profit entity that the parent trade union created for the election.Footnote 4 The remaining top contribution went from a parent trade union to one of its locals.Footnote 5 The highest contributions for 2015 were nearly 20 times higher than those for 2011, in the $200,000 range.
For the 2019 election, the top contribution was over $700,000 from an individual to their own policy institute. Several top contributors were once again trade unions donating to entities that they or their parent unions created for the election.Footnote 6 In one case, the contribution went to a non-profit organization supported by unions.Footnote 7 In another case covered by the media, an Alberta-based corporation collected donations from contributors and distributed them to five loosely affiliated third parties.Footnote 8 The three highest contributions for 2019 increased again to $500,000 and over.
| Election | Contributor name | Contributor type | Total contribution | Contributed to which third party |
|---|---|---|---|---|
| 2011 | Robert Colborne | Individual | $10,500 | National Citizens Coalition |
| 2011 | Fédération des travailleurs du Québec | Trade union | $10,000 | Les Sans-Chemise |
| 2011 | Confédération des syndicats nationaux | Trade union | $10,000 | Les Sans-Chemise |
| 2011 | John Elliot | Individual | $10,000 | National Citizens Coalition |
| 2011 | Darey Rector | Individual | $10,000 | National Citizens Coalition |
| 2015 | International Union of Operating Engineers Local 955 | Trade union | $271,000 | Canadians United for Change |
| 2015 | International Union of Operating Engineers Local 793 | Trade union | $250,000 | Canadians United for Change |
| 2015 | International Union of Operating Engineers Local 115 | Trade union | $225,000 | Canadians United for Change |
| 2015 | Communications Workers of America Canada | Trade union | $188,718 | Canadian Media Guild (CMG) |
| 2019 | Walter Schroeder | Individual | $704,000 | 2713350 Ontario Inc. (Schroeder Policy Group Inc.) |
| 2019 | Canadian Labour Congress | Trade union | $616,035 | Fairness Works |
| 2019 | Service Employees International Union Local 1 | Trade union | $500,000 | Working Ontario Women |
| 2019 | International Brotherhood of Electrical Workers | Trade union | $330,000 | Let's Build Canada |
| 2019 | Manning Centre for Building Democracy | Corporation – no shares | $312,450 | Canada Strong and Proud; Québec Fier; Proudly New Brunswick; NS Proud; NL Strong |
| 2019 | United Association of Journeymen and Apprentices | Trade union | $300,000 | Let's Build Canada |
*The highest reported contributions for 2011 and 2015 were in fact $55,567 and $255,872 from a trade union to itself. However, these were omitted from the table since they should have been reported as the trade union's use of its own resources.
3.2.4. Contributions by geographical location
As explained earlier, only total contributions over $200 from a single contributor are reported with location data. The number of contributors making such contributions steadily increased from the 2011 to 2019 general elections, from 990 to more than double that amount at 2,306. Generally, as more contributors gave to third parties, more regions of the country were represented.
Ontario, British Columbia and Alberta topped the list of contributor locations for each election. In other parts of the country, there were sometimes significant fluctuations in numbers from one election to the next. For example, the number of contributors in Quebec, Manitoba and all Atlantic provinces, except New Brunswick, was higher in 2015 than in the elections before and after it. In 2019, the significant jump in contributors in Saskatchewan was due to a provincial political party having to register and report thousands of contributors (with close to 400 giving over $200), as the party could not identify who had contributed for the purpose of its third party activities.
| Province/Territory | 2011 | 2015 | 2019 |
|---|---|---|---|
| Ontario | 489 | 628 | 898 |
| British Columbia | 217 | 427 | 403 |
| Alberta | 127 | 192 | 295 |
| Quebec | 56 | 112 | 82 |
| Saskatchewan | 34 | 47 | 514 |
| Manitoba | 30 | 40 | 26 |
| Nova Scotia | 16 | 29 | 23 |
| New Brunswick | 13 | 14 | 34 |
| Northwest Territories | 3 | 1 | 6 |
| Prince Edward Island | 3 | 5 | 2 |
| Newfoundland and Labrador | 1 | 14 | 11 |
| Yukon | 1 | 6 | 12 |
| Nunavut | 0 | 0 | 0 |
| Total | 990 | 1,515 | 2,306 |
In dollar amounts, the highest total contributions were consistently recorded in Ontario, British Columbia, Alberta and Quebec. Amounts in these four provinces represented between 92% and 94% of contributions with a known location for the 2011 to 2019 elections. Ontario's tally remained well above the others in each election.
In some provinces such as British Columbia and Newfoundland and Labrador the decrease in total contributions from 2015 to 2019 was markedly disproportionate to the decrease in contributors. As there is no limit on contributions to third parties, a small number of gained or lost contributions between elections can make a large difference to the total amount in any region. As explained above, the significant increase in Saskatchewan in 2019 is partly attributed to a provincial political party. It reported $192,000 in contributions over $200, though only $2,000 in expenses.
Notably, close to $1.5 million in contributions in each election were not associated with a province or territory. This amount is largely composed of contributions of $200 or less, for which no location data is reported. It also includes a small number of contributions made by eligible contributors with international addresses or for which data is missing (amounting to 5% of contribution dollars in 2011, 2% in 2015 and 1% in 2019). Data on contributions of $200 or less are provided in Table 4.
| Province/Territory | 2011 | 2015 | 2019 | Total |
|---|---|---|---|---|
| Ontario | $214,138 | $1,307,598 | $3,454,966 | $4,976,702 |
| No location* | $1,547,290 | $1,644,035 | $1,466,695 | $4,658,020 |
| Alberta | $66,700 | $543,139 | $1,280,211 | $1,890,050 |
| British Columbia | $160,201 | $850,596 | $283,061 | $1,293,858 |
| Quebec | $40,628 | $304,524 | $265,472 | $610,624 |
| Saskatchewan | $14,335 | $19,943 | $414,981 | $449,259 |
| Newfoundland and Labrador | $205 | $67,007 | $8,284 | $75,496 |
| Manitoba | $11,031 | $55,265 | $9,096 | $75,392 |
| Nova Scotia | $4,639 | $20,041 | $32,256 | $56,936 |
| New Brunswick | $3,925 | $12,973 | $11,044 | $27,942 |
| Prince Edward Island | $0 | $10,461 | $1,862 | $12,323 |
| Yukon | $500 | $3,620 | $1,030 | $5,150 |
| Northwest Territories | $615 | $350 | $550 | $1,515 |
| Nunavut | $0 | $0 | $0 | $0 |
| Total | $2,064,207 | $4,839,552 | $7,229,508 | $14,133,267 |
*"No location" includes contributions of $200 or less, contributions from an international address or contributions for which data is missing. See the preceding paragraph for details.
3.2.5. Contributions by contribution type
Third parties report the contributions they receive as either monetary or non-monetary. Monetary contributions include cash, cheques, card payments and e-transfers. Non-monetary contributions are a service or property, or the use of property or money, provided without charge or at less than commercial value.Footnote 9 This includes forgone interest on loans; it excludes volunteer labour.
Monetary contributions were by far the most common and highest valued contribution type for the 2011 to 2019 elections, increasing from $2.1 million in 2011 to $6.9 million in 2019. This represents 97% of all contributions across the three elections. Nevertheless, non-monetary contributions also increased in value at each event, from almost $10,000 in 2011 to almost $300,000 in 2019.
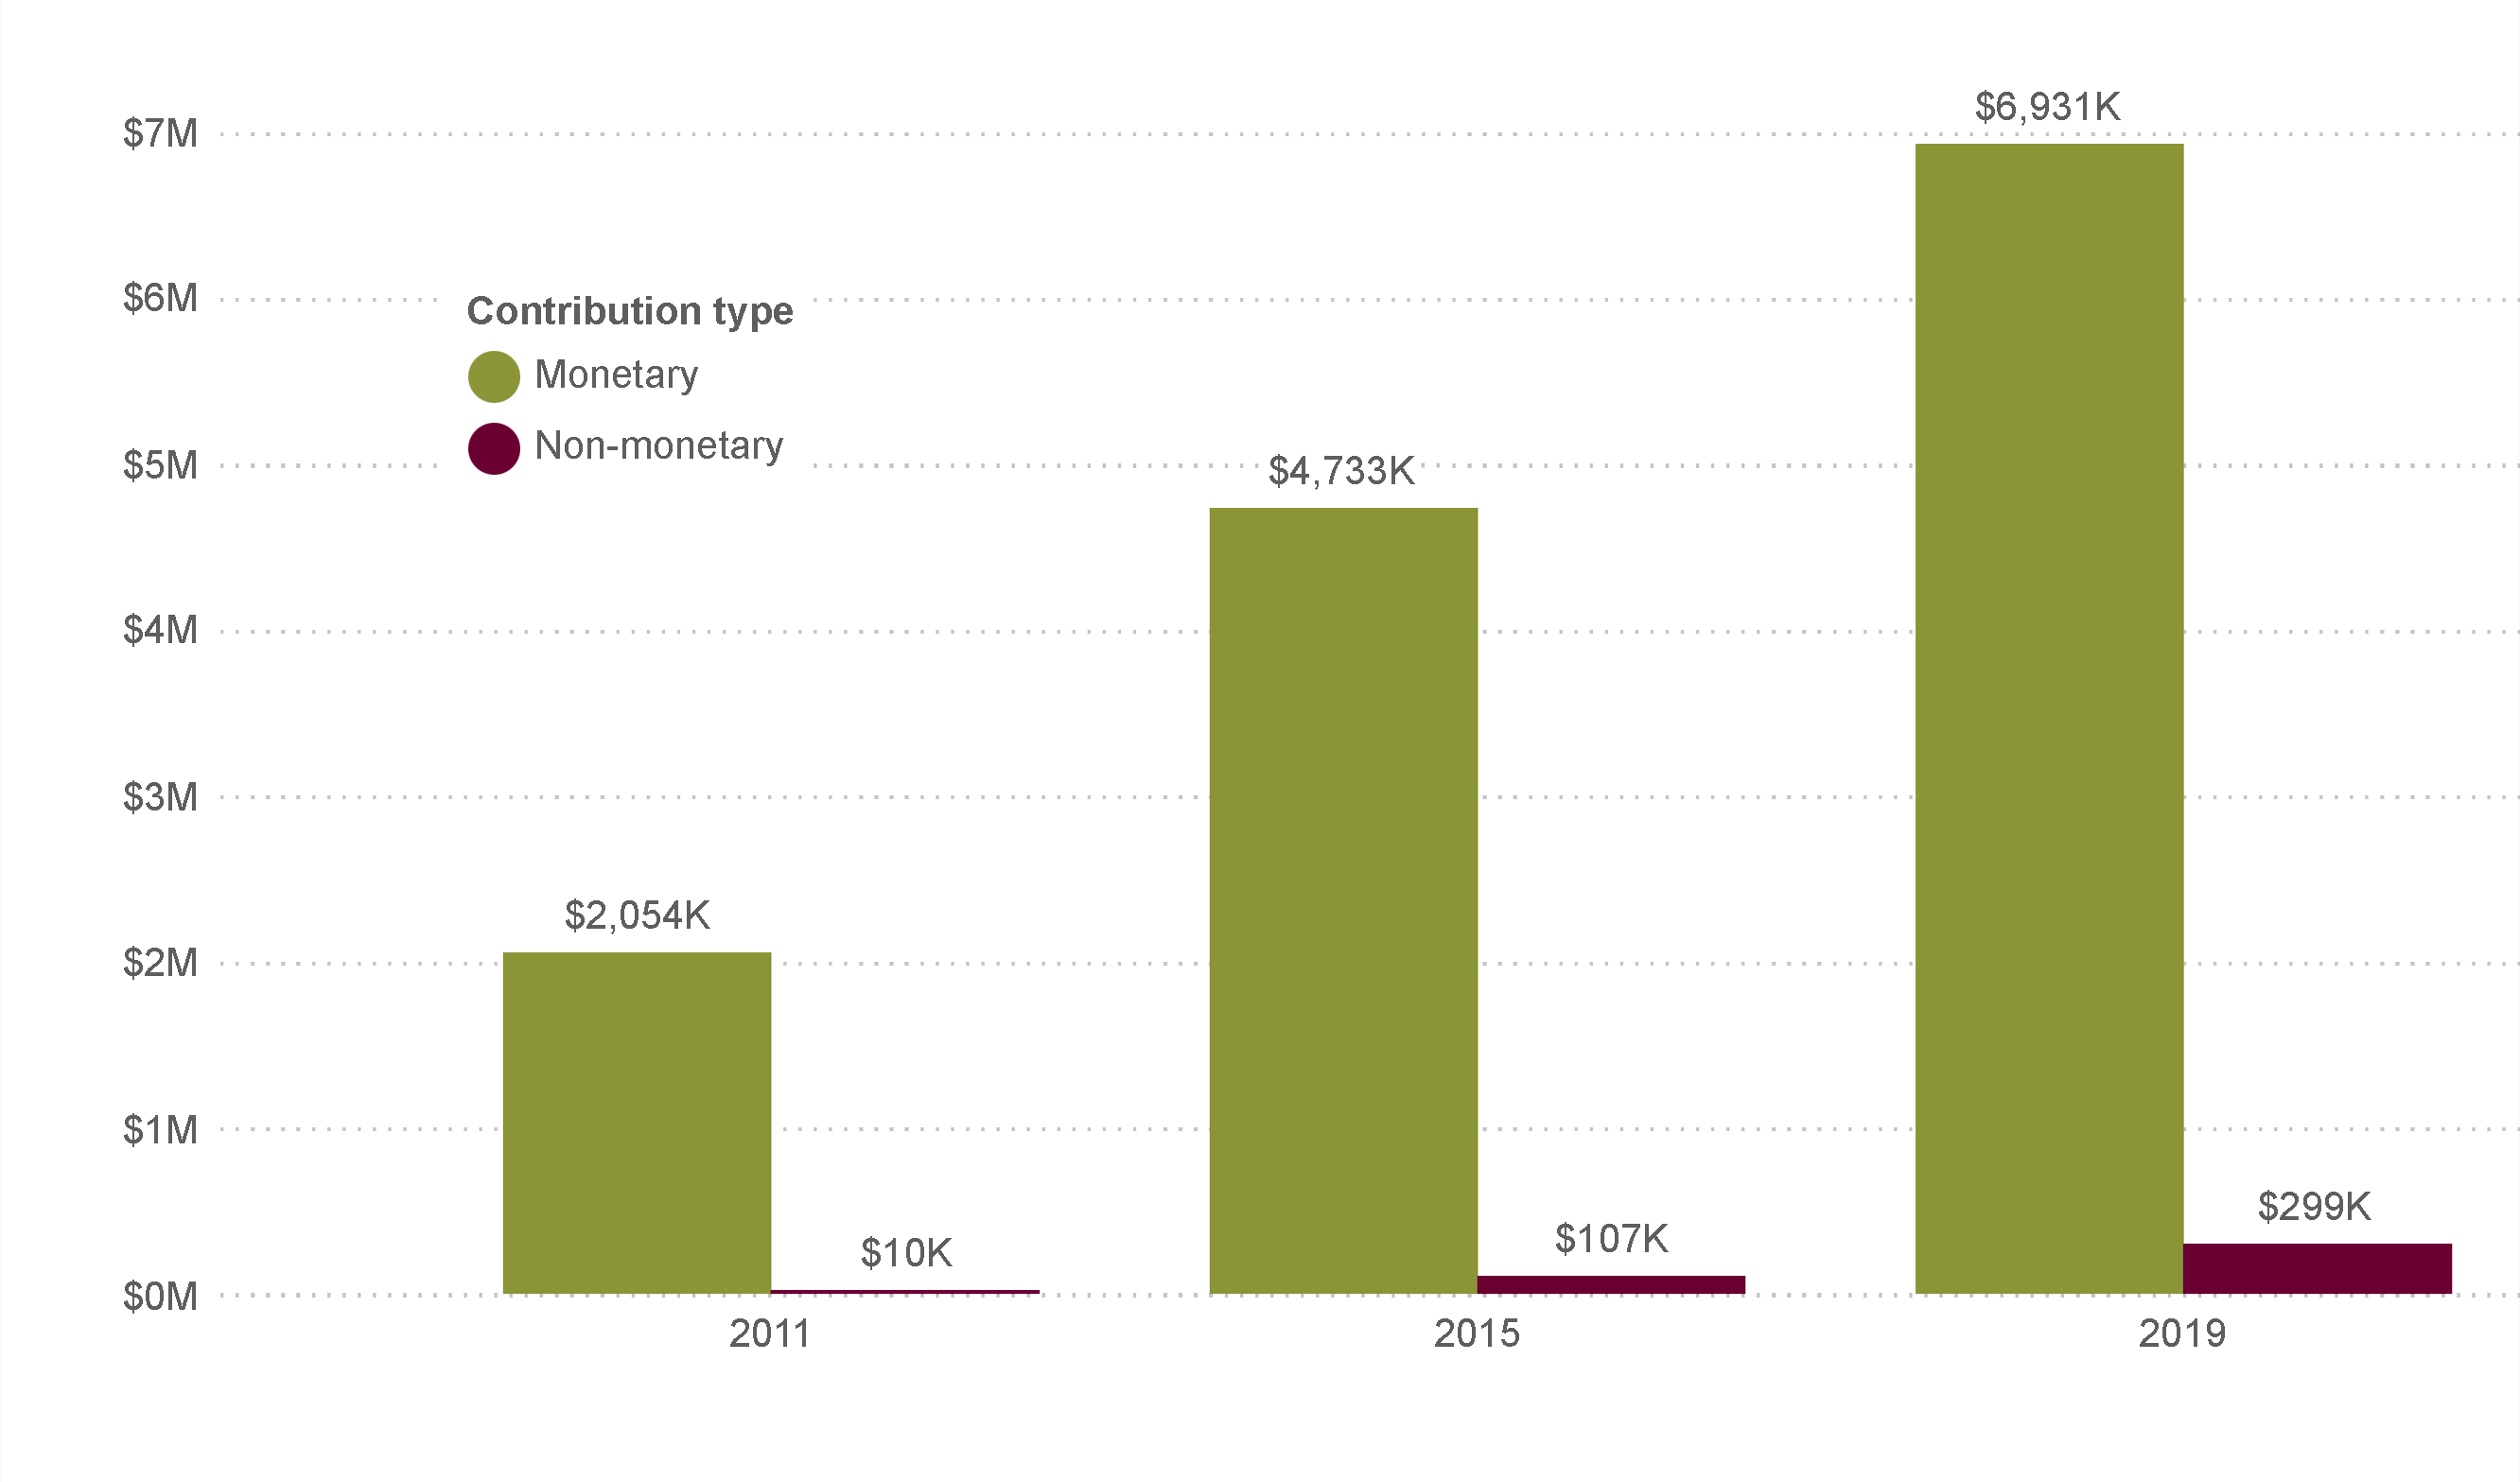
Figure 4 – Total monetary versus non-monetary contributions at the 2011, 2015 and 2019 general elections
Text version of "Figure 4 – Total monetary versus non-monetary contributions at the 2011, 2015 and 2019 general elections"
This bar chart compares total monetary contributions versus non-monetary contributions at three general elections, as follows:
- monetary contributions: $2.05 million in 2011, $4.73 million in 2015, $6.93 million in 2019
- non-monetary contributions: $10,000 in 2011, $107,000 in 2015, $299,000 in 2019
3.3. Own resources
A third party that exists outside an election such as a corporation or trade union can use its own resources at election time to carry out regulated activities. It can transfer any amount of its own funds from its general bank account to its campaign bank account. However, a third party must not use funds from a foreign entityFootnote 10 to pay for regulated activities. If the third party has revenues from a mix of foreign and domestic sources, it must transfer an amount no greater than its domestic funding to its campaign account.
Overall, third parties used increasing amounts of their own resources for regulated activities from the 2011 to 2019 general elections. The total jumped from $179,000 to $1.7 million (an increase of 836%) from 2011 to 2015, and to $4.3 million (a further increase of 158%) from 2015 to 2019. The use of third parties' own resources also rose as a proportion of their total inflows (that is own resources used plus loans and contributions received). The proportion was 8% of total inflows in 2011, climbed to 26% in 2015 and reached 37% in 2019.
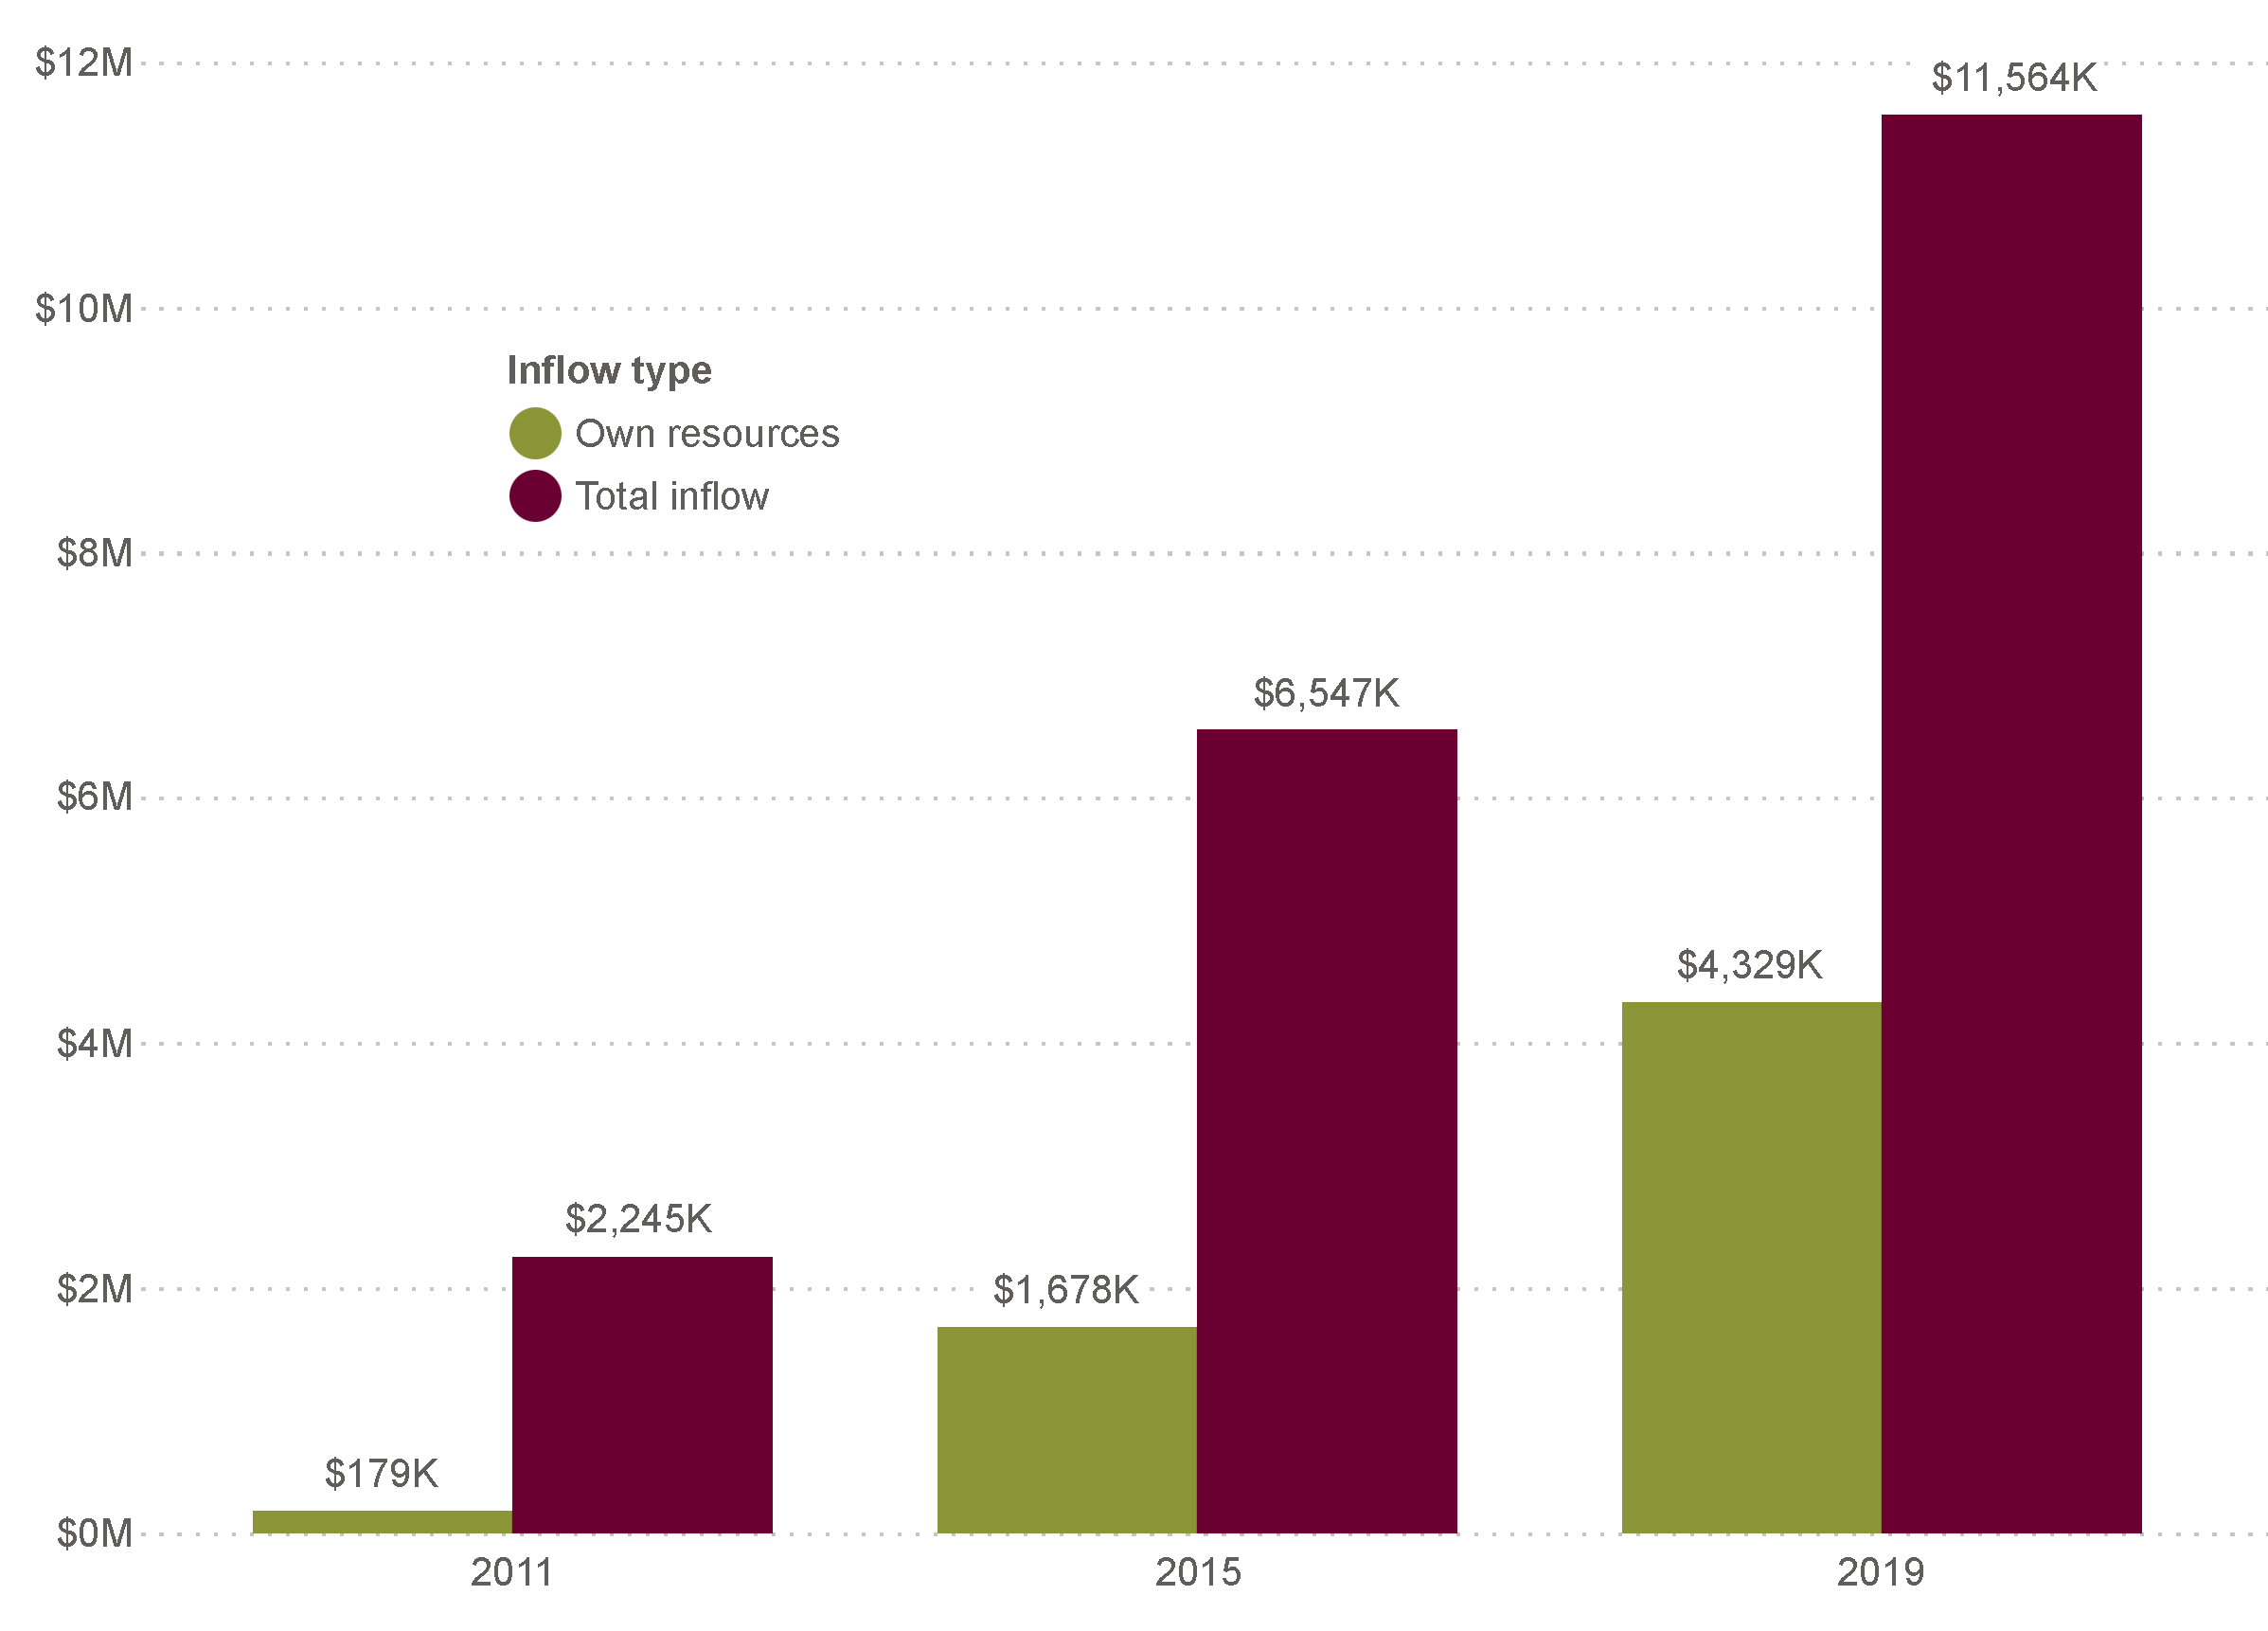
Figure 5 – Amount of own resources used as a percentage of total inflows (own resources, contributions, loans) for the 2011, 2015 and 2019 general elections
Text version of "Figure 5 – Amount of own resources used as a percentage of total inflows (own resources, contributions, loans) for the 2011, 2015 and 2019 general elections"
This bar chart shows the amount of own resources that third parties used as a proportion of their total inflows (comprised of own resources, contributions and loans) at three general elections.
For 2011, the breakdown was:
- own resources: $179,000
- total inflows: $2.25 million
For 2015, the breakdown was:
- own resources: $1.68 million
- total inflows: $6.55 million
For 2019, the breakdown was:
- own resources: $4.33 million
- total inflows: $11.56 million
Looking at the data by third party type, there are a few trends in the use of own resources from 2011 to 2019. Labour organizations consistently used their own resources as a significant source of funding for regulated activities, starting at 49% of their funding in 2011 and climbing to 92% in 2019. Registered charities used a high proportion of their own resources in 2015 (81%), but this dropped in 2019 (28%).
In dollar amounts, the use of own resources by individuals was lowest overall, staying under $4,000 at each election. Such use was highest among labour organizations ($3.7 million across the three elections) and groups with a governing body ($1.5 million across the three elections).
| Third party type | 2011 | 2015 | 2019 | |||
|---|---|---|---|---|---|---|
| Total inflow | Own resources (% of inflow) | Total inflow | Own resources (% of inflow) | Total inflow | Own resources (% of inflow) | |
| Corporation | $278,742 | 7% | $2,706,936 | 2% | $5,110,349 | 14% |
| Group – governing body | $1,771,952 | 6% | $1,216,514 | 8% | $2,835,799 | 46% |
| Group – no governing body | $62,069 | 5% | $315,638 | 12% | $1,041,154 | 4% |
| Individual | $18,248 | 18% | $14,348 | 26% | $17,546 | 7% |
| Labour organization | $114,410 | 49% | $2,182,769 | 64% | $2,448,461 | 92% |
| Registered charity | $0 | 0% | $111,196 | 81% | $110,868 | 28% |
3.4. Key findings from this chapter
- The main source of third party funding from 2011 to 2019 was contributions from individuals.
- Although contributions to third parties are unlimited, the median contribution in each election was well within the $1,200 to $1,600 limits that are set for other political entities.
- Top contributions were most often made by trade unions to affiliated unions or to entities created by affiliated unions for the election.
- Ontario, British Columbia, Alberta and Quebec were the source of 93% to 95% of contribution dollars from a known location for the 2011 to 2019 elections.
- Third parties used an increasing amount of their own resources from 2011 to 2019 to fund their regulated activities, reaching 37% of their funding in 2019.
- Labour organizations were the only third party type to consistently use their own resources as a large part of their funding (49% or more) in each election.
Footnotes
Return to source of footnote 3 Les Sans-Chemise. (n.d.) Partenaires. https://sanschemise.org/index.php/partenaires/
Return to source of footnote 4 International Union of Operating Engineers. Local 793. (2015). Locals stepping up political action. https://iuoelocal793.org/locals-stepping-up-political-action/
Return to source of footnote 5 Canadian Media Guild. (n.d.) About the Canadian Media Guild. https://www.cmg.ca/en/about-us/
Return to source of footnote 6 See the relationship between the Canadian Labour Congress and Fairness Works at http://fairnessworks.ca. See the relationship between Let's Build Canada and Canada's Building Trade Unions in Let's Build Canada, n.d., About at https://www.letsbuildcanada.ca/about.
Return to source of footnote 7 Working Ontario Women. (n.d.) About WOW. https://actwow.ca/about/
Return to source of footnote 8 Keller, James, and Kelly Cryderman. "Manning Centre won't disclose source of donations to third parties for attack ads on Liberals." The Globe and Mail. 16 October 2019. https://www.theglobeandmail.com/canada/article-manning-centre-wont-disclose-source-of-donations-to-third-parties-for/
Return to source of footnote 9 Commercial value, in relation to property or a service, is the lowest amount charged at the time that it was provided for the same kind and quantity of property or service, or for the same use of property or money, by the person who provided the property or service (if the person who provided it is in that business), or by another person who provides that property or service on a commercial basis in the area (if the person who provided the property or service is not in that business).
Return to source of footnote 10 A foreign entity includes the following: an individual who is not a Canadian citizen or permanent resident; a corporation or entity organized outside Canada that does not carry on business in Canada; a corporation or entity organized outside Canada whose only activity in Canada is to influence electors to vote or refrain from voting, either in general or for a particular candidate or registered party in the election; a trade union that does not hold bargaining rights for employees in Canada; a foreign political party; or a foreign government or an agent of a foreign government.