 Site Menu
Analysis of Financial Trends of Regulated Federal Political Entities, 20002014
2. Net Assets
This section presents the net assets of registered parties and their affiliated EDAs from 2003, prior to the introduction of Bill C-24, until 2014. The net asset position of an ongoing political entity is equivalent to its net worth and is a key indicator of financial health.
a) Overall registered party and EDA net assets, 2003 to 2014
The net asset positions presented are for registered parties and their EDAs. They have been grouped together to provide a more accurate picture of overall wealth given the fact that resources may be shared freely between a party and its EDAs. From 2004 to 2014, EDAs received $149 million in contributions that helped them achieve an average annual net asset position in this time frame of $26 million; this represents, on average, 63% of the financial wealth of registered parties and their EDAs.
The net asset position of all registered parties and their EDAs grew from $7.8 million in 2004 to $81.7 million in 2014.Footnote 10 In 2014, the breakdown of net assets was $40.4 million belonging to registered parties and $41.3 million to their EDAs.
b) Net assets by each registered party
Some registered parties have done better than others under the post-Bill C-24 regime. Registered parties that became eligible for the quarterly allowances in 2004 are in a better financial situation in 2014 than they were in 2004. The registered parties that were not eligible for quarterly allowances and that rely on their ability to fundraise also have generally improved their financial situation over the same period, although to a much lesser extent, despite the incidence of four general elections.
The registered parties that were eligible for the quarterly allowance saw their collective net asset position grow by $72.5 million from 2004 to 2014, which is broken down as follows: the Conservative Party's net asset position grew by $35.7 million, the Liberal Party's by $19.8 million, the New Democratic Party's (NDP) by $8.1 million, the Bloc Québécois' by $4.3 million and the Green Party's by $4.6 million. Overall, the gap between the smaller parties and the larger parties has increased since 2004.
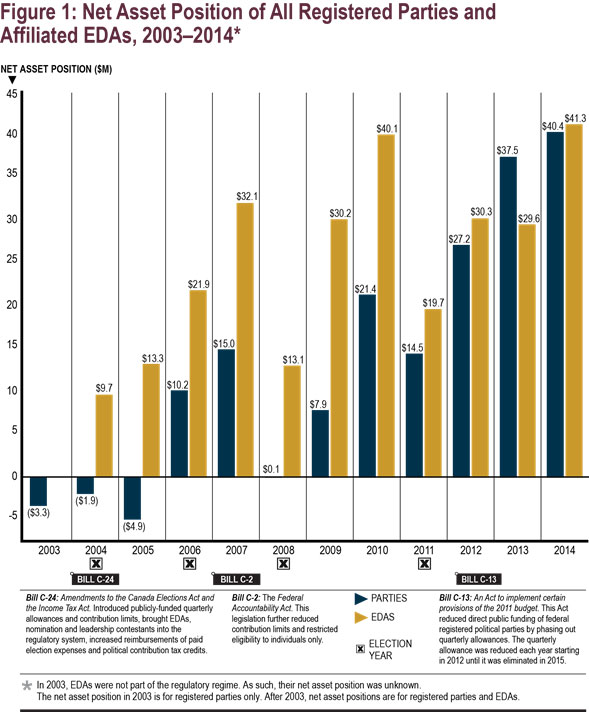
Figure 1: Net Asset Position of All Registered Parties and Affiliated EDAs, 2003–2014 – Text version
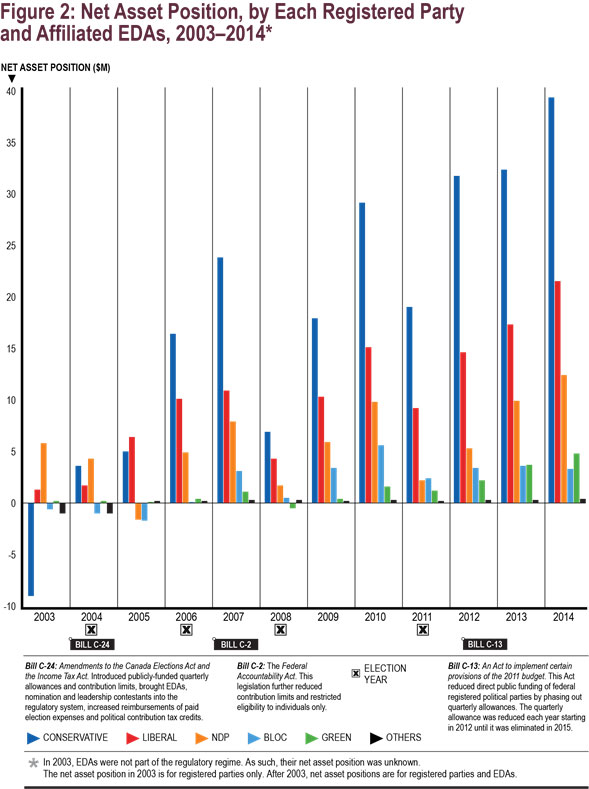
Figure 2: Net Asset Position, by Each Registered Party and Affiliated EDAs, 2003–2014 – Text version
Return to source of Footnote 10 Before 2004, EDAs were not part of the regulatory regime. As such, their net asset position was unknown. The net asset positions in 2003 on figures 1 and 2 are for registered parties only.