 Site Menu
Social and Political Orientations – Generation Z: Portrait of a New Generation of Young Canadians and How They Compare to Older Canadians
This first section presents the social and political orientations of Generation Z and how they compare with those of Millennials, Gen Xers and Boomers.
1. Social attitudes
a. Trust toward others
A standard survey item measures respondents' general trust in other individuals. It reads: "Generally speaking, would you say that most people can be trusted, or that you need to be very careful when dealing with people?" The answers reveal a relatively low level of generalized trust, with a mean score of 0.46 on a scale where 0 corresponds to the belief that we need to be careful with people and 1 indicates the belief that most people can be trusted.
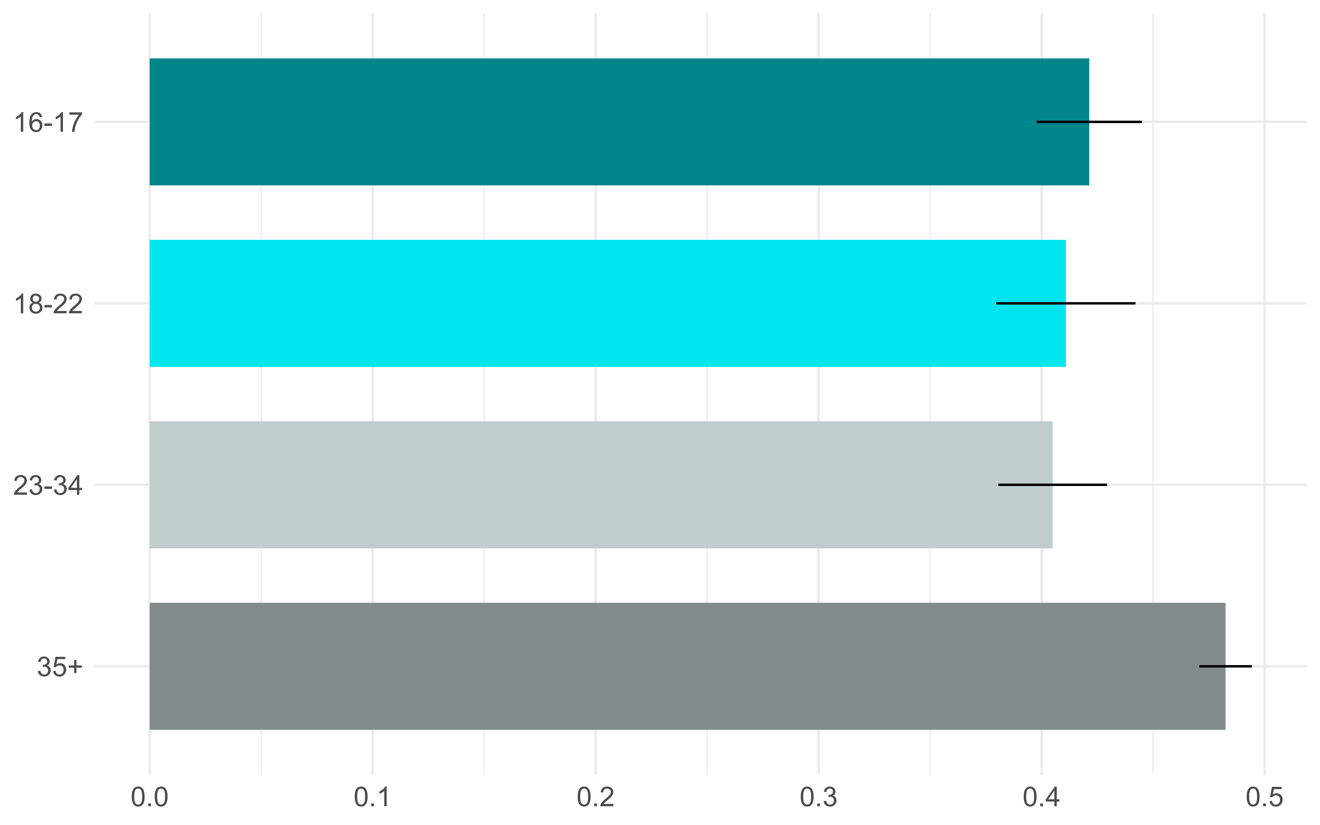
Responses to this question vary significantly by generational cohort (Figure 2). Those 35 years and older report higher generalized trust levels than the three other age groups. The gap in trust scores between those born before 1985 and the other groups is slightly under 10 percentage points. Older cohorts in the sample show more trust in people, in general; however, it is unclear whether this finding is due to a life-cycle effect or a genuine generational effect.
Figure 2: Levels of generalized trust, by age group (with 95% confidence intervals)
Text version of "Figure 2: Levels of generalized trust, by age group (with 95% confidence intervals)"
This horizontal bar chart shows respondents' average generalized trust scores by age group. The scores range from 0, indicating the belief that we need to be careful with people, to 0.5, indicating the belief that most people can be trusted. The average scores are as follows:
- Aged 16–17: 0.42
- Aged 18–22: 0.41
- Aged 23–34: 0.40
- Aged 35+: 0.48
b. Materialism
Beliefs associated with the accumulation of goods and wealth are a value dimension where generational differences may be observed. Baby Boomers are often depicted as being less materialistic in their outlook, whereas newer generations are often expected to have developed views more sympathetic to materialism, either due to the more difficult economic context in which they grew up (compared with Baby Boomers) or as a reaction to the values held by their elders.
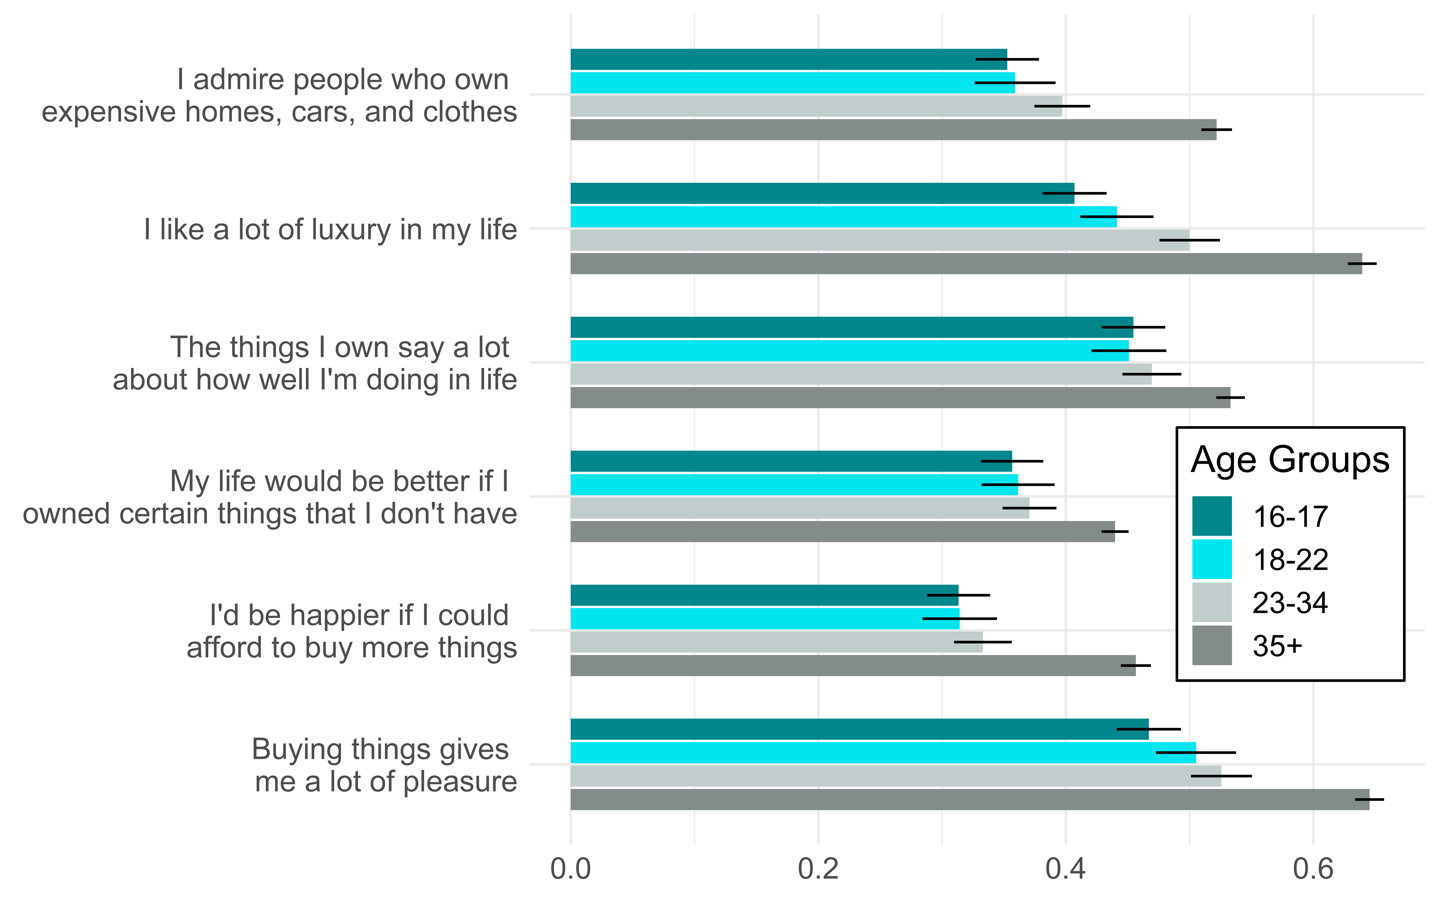
We rely on a six-item measure of materialism to examine differences in materialist values. These items relate to materialism's centrality to one's life, the happiness that materialism brings to one, and the equation one makes between materialism and success in life (Richins 2004). Figure 3 presents the average scores, by cohort, on these measures. Scores increase from one age group to the other: Canadians aged 16–17 are the least materialistic, while those 35 years and older are the most materialistic. The differences across cohorts are neither very large nor statistically significant between those aged 16–17, 18–22, and 23–34. Overall, these results suggest an explanation of the development of materialist values that relates more to the life cycle: Older citizens have more material comfort and can enjoy it, compared with younger citizens who are often students, employed part-time or in precarious jobs, and who have not yet accumulated wealth, and thus tend to focus less on material goods.
Figure 3: Respondents' reported levels of materialism, by age group (with 95% confidence intervals)
Text version of "Figure 03: Respondents' reported levels of materialism, by age group (with 95% confidence intervals)"
This horizontal bar chart shows the average agreement score by age group for statements about materialist values. The agreement scores range from 0.0 (strongly disagree) to 0.7 (strongly agree). The averages are as follows:
- I admire people who own expensive homes, cars, and clothes.
- Aged 16–17: 0.35
- Aged 18–22: 0.36
- Aged 23–34: 0.40
- Aged 35+: 0.52
- I like a lot of luxury in my life.
- Aged 16–17: 0.41
- Aged 18–22: 0.44
- Aged 23–34: 0.50
- Aged 35+: 0.64
- The things I own say a lot about how well I'm doing in life.
- Aged 16–17: 0.45
- Aged 18–22: 0.45
- Aged 23–34: 0.47
- Aged 35+: 0.53
- My life would be better if I owned certain things that I don't have.
- Aged 16–17: 0.36
- Aged 18–22: 0.36
- Aged 23–34: 0.37
- Aged 35+: 0.44
- I'd be happier if I could afford to buy more things.
- Aged 16–17: 0.31
- Aged 18–22: 0.31
- Aged 23–34: 0.33
- Aged 35+: 0.46
- Buying things gives me a lot of pleasure.
- Aged 16–17: 0.47
- Aged 18–22: 0.51
- Aged 23–34: 0.53
- Aged 35+: 0.65
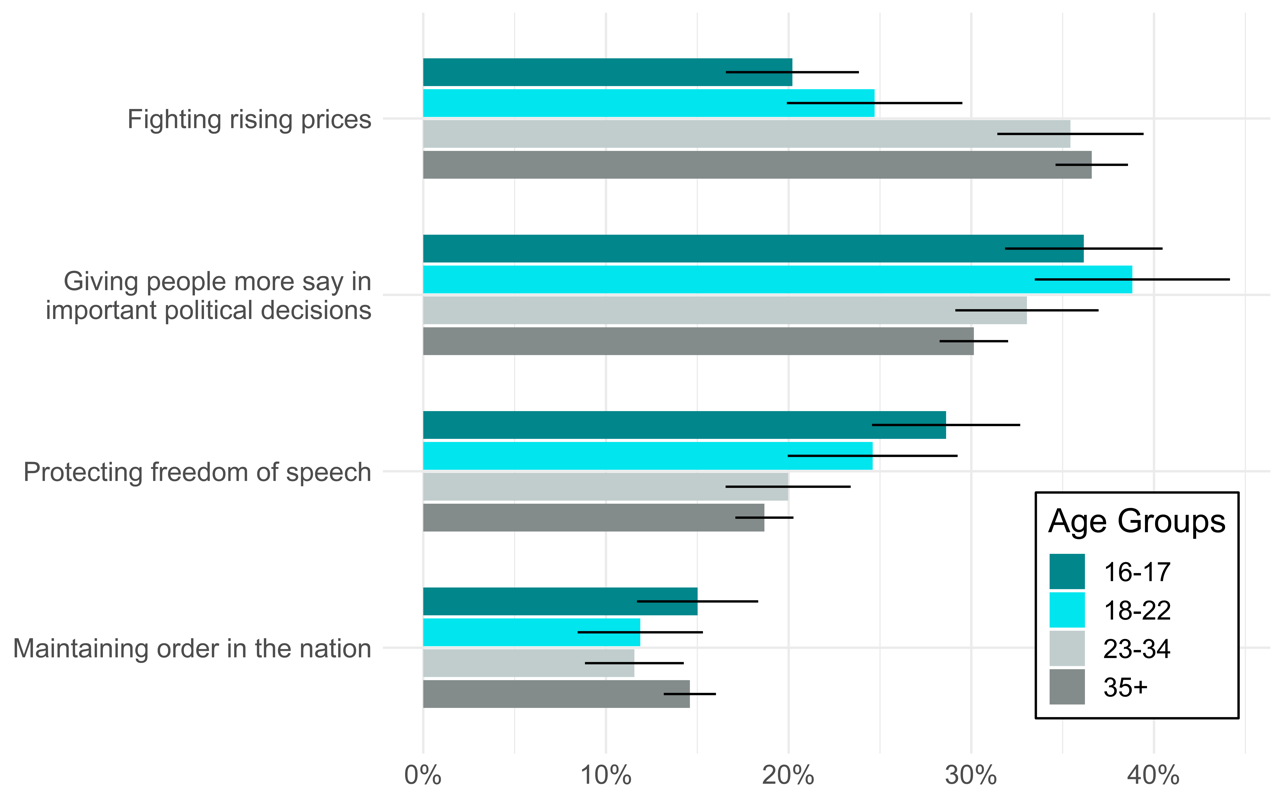
A similar pattern exists within our sample on the post-materialism scale. This measure comes from the work of Inglehart (2008) and determines the priority that individuals give to four different goals to be pursued by their nation. Two of these goals are deemed to be materialist in nature (fighting rising prices and maintaining order in the nation) and the other two are considered post-materialist (protecting freedom of speech and giving people more say in important political decisions). Figure 4 displays the percentage of respondents who give priority to different state goals. It shows that post-materialist attitudes are more prevalent among those aged 16–17 and 18–22 (with no statistical difference between these two groups), significantly less prevalent among those aged 23–34 and especially among those aged 35 and older (with no statistical difference between these two). This result is in line with Inglehart's post-materialism thesis, according to which each new generation is more post-materialist than the previous one.
Figure 4: Preferences for state goals included in the post-materialist scale, by age group (with 95% confidence intervals)
Text version of "Figure 04: Preferences for state goals included in the post-materialist scale, by age group (with 95% confidence intervals)"
This horizontal bar chart shows the percentage of respondents giving priority to different state goals, by age group. The percentages are as follows:
- Fighting rising prices
- Aged 16–17: 20%
- Aged 18–22: 25%
- Aged 23–34: 35%
- Aged 35+: 37%
- Giving people more say in important political decisions
- Aged 16–17: 36%
- Aged 18–22: 39%
- Aged 23–34: 33%
- Aged 35+: 30%
- Protecting freedom of speech
- Aged 16–17: 27%
- Aged 18–22: 25%
- Aged 23–34: 20%
- Aged 35+: 19%
- Maintaining order in the nation
- Aged 16–17: 15%
- Aged 18–22: 12%
- Aged 23–34: 12%
- Aged 35+: 15%
2. Political attitudes
a. Political trust
We asked all respondents how much they trusted different institutions central to Canadian society: the police, the federal government, and their provincial government. Responses range from 0, meaning the respondent does "not trust at all," to 1, where the respondent "trusts a lot" in the institution.
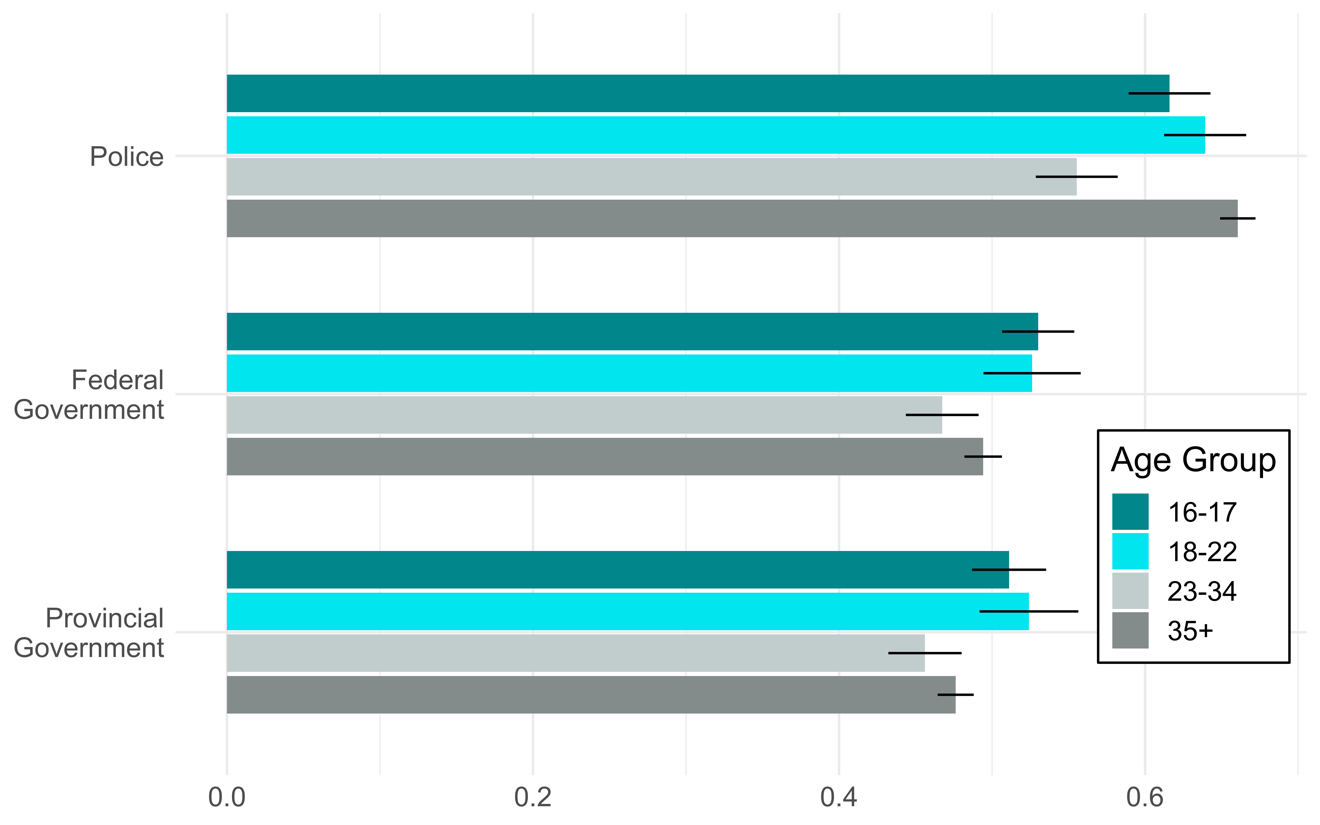
Overall, trust in the police was highest, with a mean of 0.64. By contrast, average levels of trust are relatively low for political institutions within the Canadian population. Both the federal government and the provincial government obtain trust scores below the midpoint of 0.5, with scores of roughly 0.48 and 0.49, respectively. We also asked Canadians whether they agreed or not with the following statement: "The federal government can be trusted to protect the personal information of Canadians." Canadians are, on average, relatively neutral, neither trusting nor distrusting the federal government to protect citizens' personal information (and there are no differences in this type of trust between the four age groups).
Figure 5 presents the average trust level by age group for each of the three institutions. Again, we observe significant differences between the age groups. The main finding is that those aged 16–17 and 18–22 are more trusting of the federal and provincial government than the two older age groups. Most of these age differences are statistically significant; however, there is no significant difference in the levels of political trust between those aged 16–17 and 18–22. For the police, the oldest cohort is the most trusting (with a trust score of about 0.66), followed by the two Gen Z groups (with scores of 0.62 and 0.64) and, finally, the Millennials (with a score of roughly 0.55).
Figure 5: Levels of trust in three institutions, by age group (with 95% confidence intervals)
Text version of "Figure 05: Levels of trust in three institutions, by age group (with 95% confidence intervals)"
This horizontal bar chart shows the average trust scores for three different institutions by age group. The trust scores range from 0 (does not trust the institution at all) to 1 (trusts the institution a lot). The scores are as follows:
- Police
- Aged 16–17: 0.62
- Aged 18–22: 0.64
- Aged 23–34: 0.56
- Aged 35+: 0.66
- Federal government
- Aged 16–17: 0.53
- Aged 18–22: 0.53
- Aged 23–34: 0.47
- Aged 35+: 0.49
- Provincial government
- Aged 16–17: 0.51
- Aged 18–22: 0.52
- Aged 23–34: 0.46
- Aged 35+: 0.48
b. Political cynicism
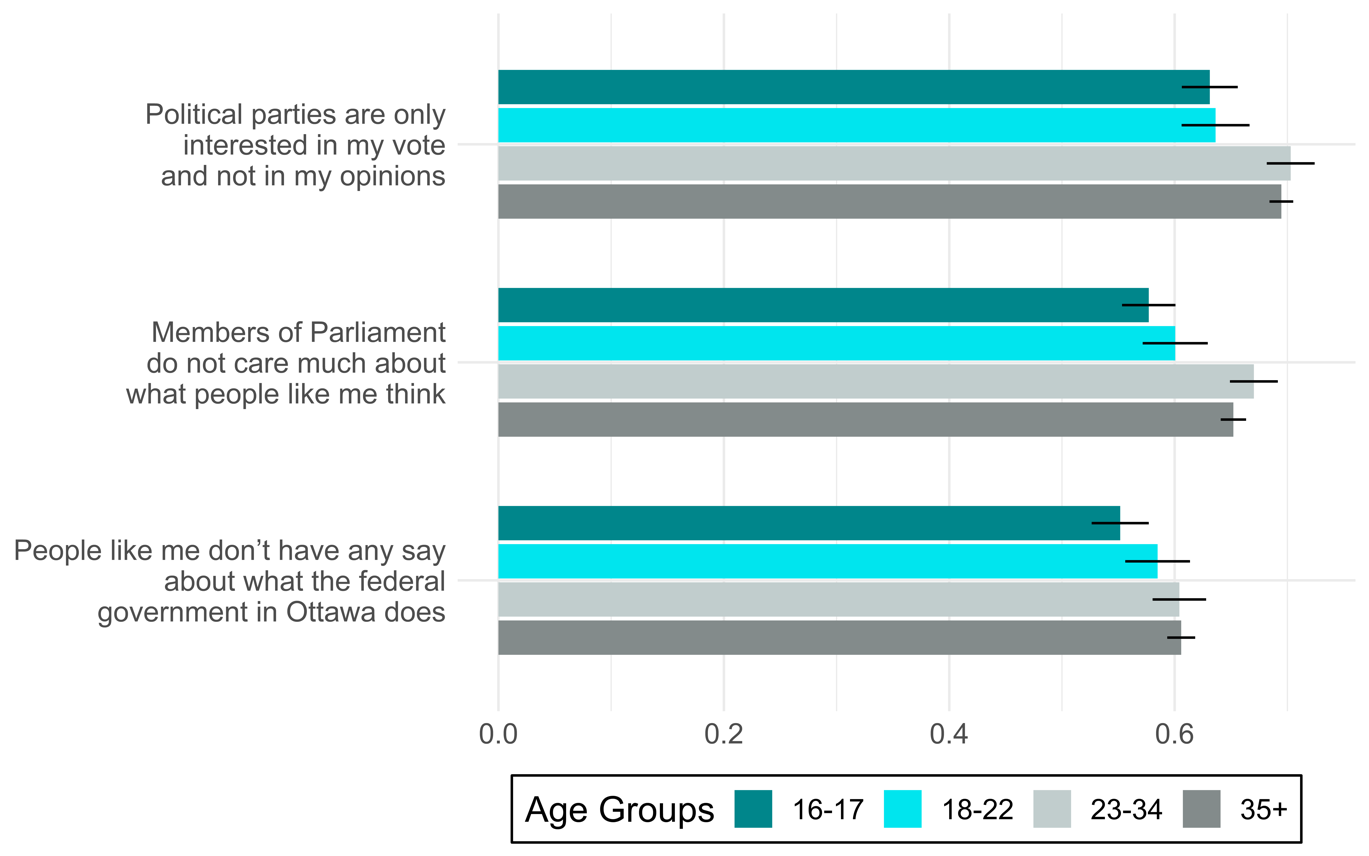
We examine cynicism through several questions related to external efficacy (i.e. the belief that political actors are in tune or not with citizens). We asked respondents to tell us how much they agreed or disagreed with the following three statements: "Members of Parliament don't care much about what people like me think," "People like me don't have a say in government affairs," and "Political parties are only interested in people's votes, not their opinions." Levels of agreement were measured on a scale ranging from 0, or "strongly disagree," to 0.5, "neither agree nor disagree," to 1, "strongly agree."
Across the sample, Canadians tend to agree somewhat with these statements. However, we find clear distinctions between Gen Z and older Canadians: Young Canadians are less cynical.
As shown in Figure 6, there are no significant differences between the two age groups of Generation Z, even if those aged 16–17 tend to be less cynical than those aged 18–22. Indeed, the main difference is found between Gen Zers and older Canadians, who are slightly but significantly more likely to say that they agree somewhat that "members of Parliament don't care much about what people like me think" and that "political parties are only interested in people's votes, not their opinions." For these two statements, we observe a difference of approximately 5 percentage points between the two younger age groups and the two older age groups.
For the final statement, "people like me don't have a say in government affairs," all age groups are generally closer to a neutral position (i.e. neither agree nor disagree) and differences between age groups are not all statistically significant. However, those aged
16 to 17 remain the less cynical group, especially when compared to those aged 35 and older.
Even if some scholars have talked about the rise of critical citizens, with younger generations being less deferential to politicians and more critical of political actors (Norris 1999; Dalton 2008), the results presented here tend to support the findings of prior research, where young Canadians are not the most politically cynical group of citizens (Mahéo and Vissers 2016). The generational explanation may point to the fact that overall and over time, citizens become more cynical, but the age difference found among Canadians in 2019 may point to a life cycle explanation. Eighteen-to-22-year-olds, and especially 16-to-17-year-olds, have less experience with political institutions than older Canadians, and thus have had fewer opportunities to be disappointed by political actors and their actions.
This does not negate the possibility of today's youngest voters being less deferential to politicians and more critical of political actors than the young voters of prior decades. Having access to panel data and being able to re-interview the same respondents over the years would allow us to examine whether citizens become more cynical and disenchanted as they grow older and as they have more interactions with political powers, and to compare generations at the same point in their life cycles.
Figure 6: Levels of cynicism expressed about political parties and institutions, by age group (with 95% confidence intervals)
Text version of "Figure 06: Levels of cynicism expressed about political parties and institutions, by age group (with 95% confidence intervals)"
This horizontal bar chart shows the average agreement score with three different statements. Levels of agreement were measured with a scale from 0 for "strongly disagree" to 1 for "strongly agree." The scores are as follows:
- Political parties are only interested in my vote and not in my opinions.
- Aged 16–17: 0.63
- Aged 18–22: 0.64
- Aged 23–34: 0.70
- Aged 35+: 0.69
- Members of Parliament do not care much about what people like me think.
- Aged 16–17: 0.58
- Aged 18–22: 0.60
- Aged 23–34: 0.67
- Aged 35+: 0.65
- People like me don't have any say about what the federal government in Ottawa does.
- Aged 16–17: 0.55
- Aged 18–22: 0.58
- Aged 23–34: 0.60
- Aged 35+: 0.61
c. Satisfaction with democracy
While in the previous section we found mild feelings of cynicism, Canadians are nonetheless somewhat satisfied with the way democracy works in Canada. In fact, Canadians rank their level of satisfaction with democracy above the mid-point (on a scale from 0 for "not satisfied at all" to 1 for "very satisfied"), at roughly 0.6. Here again, we find that Gen Z is slightly more positive towards politics than the two older age groups, with an average satisfaction level of 0.65 compared with 0.58 and 0.59 for Millennials and GenX/Boomers (the differences between age groups are statistically significant). As in the previous section, the life cycle explanation, linked to the youngest generation's lack of political experience, might explain why today's youth evaluate Canadian democracy more positively.
d. Who should make policy decisions in democracy?
While in the previous section we assessed citizens' satisfaction with the current state of Canadian democracy, we also wanted to know whether citizens would like democratic affairs to be conducted in a different way. So we asked Canadians whether they thought citizens should be more involved in decision-making processes or if policy decisions should be left to politicians.
In general, Canadians tend to say that they favour a middle ground between citizens' and politicians' involvement in policy decisions. Put another way, they would prefer the involvement of both citizens and politicians. On a scale from 0, meaning "citizens should make decisions," to 1, meaning "politicians should make decisions," the average opinion of the Canadian population is 0.53, almost perfectly centered.
However, looking more specifically at the responses given by each age group, we find that Millennials and Generation Z tend to favour slightly more involvement of citizens than politicians in political decisions, with an average score of 0.46, while Gen Xers and Boomers tend to favour only slightly more the involvement of politicians than of citizens in political decisions, with an average score of 0.53.
Even though the differences between younger and older Canadians are not large, they tend to align with the "critical citizen" argument (Norris 1999; Dalton 2008), which presents younger generations as more critical of politicians and more favourable to the idea of an engaged citizenry.
e. Partisanship
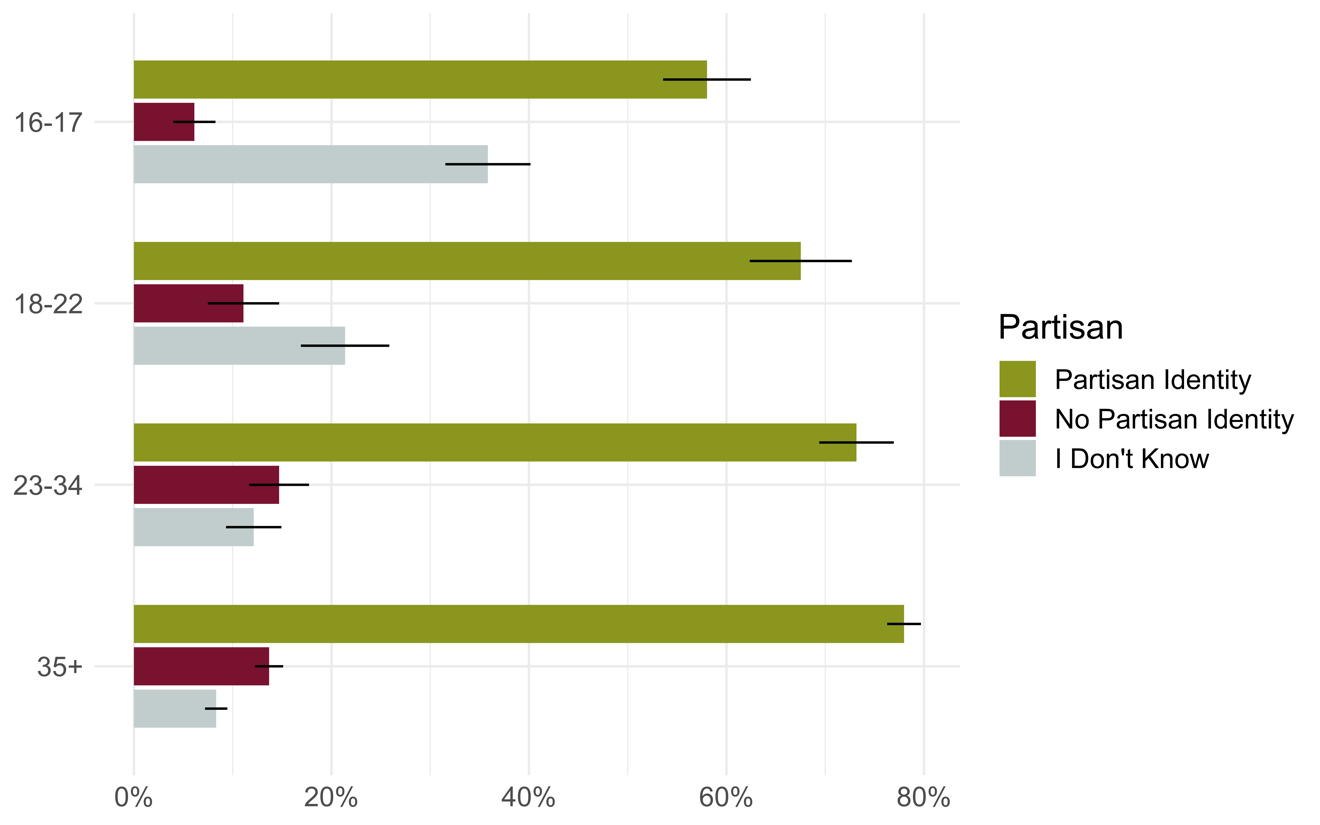
In general, recent studies have shown that younger generations do not identify as much with political parties, compared with previous generations (Bartels et al. 2011; Clarke and McCutcheon 2009; Herrando and Jiménez-MartÃnez 2016; LaCombe and Juelich 2019). Our findings support this: With each younger cohort, the number of respondents who identify with a party diminishes. As shown in Figure 7, while close to 80% of Canadians aged 35 years or more report identifying with a federal political party, less than 70% of those aged 18–22 and less than 60% of those aged 16–17 say they identify with a political party in federal politics. Among those reporting a partisan identity, those aged 16–17 report weaker partisan attachment compared with the other three age groups.
These substantial and statistically significant gaps in levels of partisan identity between the oldest and youngest groups may be explained by a generational process and/or a life cycle process. First, studies have shown that younger generations are more critical of political elites and less inclined to electoral activities. Second, studies highlight the fact that young citizens, who are at an early stage of life that does not lead them to be as attentive to politics, will not have had the time to develop experience with electoral politics and an attachment to parties.
While we are not able to examine the generational explanation with the data at hand, we can look to the life cycle explanation. One way to do that is to look more closely at the respondents who report that they don't know whether they have a partisan identity. Figure 7 shows that the two youngest age groups, and especially those aged 16–17, are significantly more likely to report that they don't know if they identify with a party, which likely reflects their shorter experience with electoral politics and knowledge of political parties.
Figure 7: Proportions of respondents with or without a partisan identity, by age group (with 95% confidence intervals)
Text version of "Figure 07: Proportions of respondents with or without a partisan identity, by age group (with 95% confidence intervals)"
This horizontal bar chart shows the proportion of respondents by age group reporting a partisan identity, no partisan identity, or that they don't know. The breakdown is as follows:
- Aged 16–17
- Partisan identity: 58%
- No partisan identity: 6%
- I don't know: 36%
- Aged 18–22
- Partisan identity: 68%
- No partisan identity: 11%
- I don't know: 21%
- Aged 23–34:
- Partisan identity: 73%
- No partisan identity: 15%
- I don't know: 12%
- Aged 35+:
- Partisan identity: 78%
- No partisan identity: 14%
- I don't know: 8%
One notable finding is that the youngest (aged 16–17) and oldest (aged 18–22) Gen Zers report distinct levels of partisan attachment. The youngest are much more likely to say that they don't know if they have a partisan attachment. There is a statistically significant 15-percentage point gap between the two groups. So while they are very close in age, in terms of their life context and other measures of political engagement (as shown later in this report), they have clearly distinct relations to federal political parties. We hypothesize that this may be due to enfranchisement. As those aged 18 to 22 have the right to vote, it would seem that they had reflected more on their political orientation and affiliation in the sphere of federal politics, and were more able to establish with which party they identified, compared to those aged 16 to 17, who did not yet have the right to vote. In sum, while both groups of Gen Zers may share common political traits and orientations, the important step of enfranchisement in the political life of citizens creates a different rapport with political parties, even if only temporarily.