 Site Menu
Infographic of Voter Turnout by Age
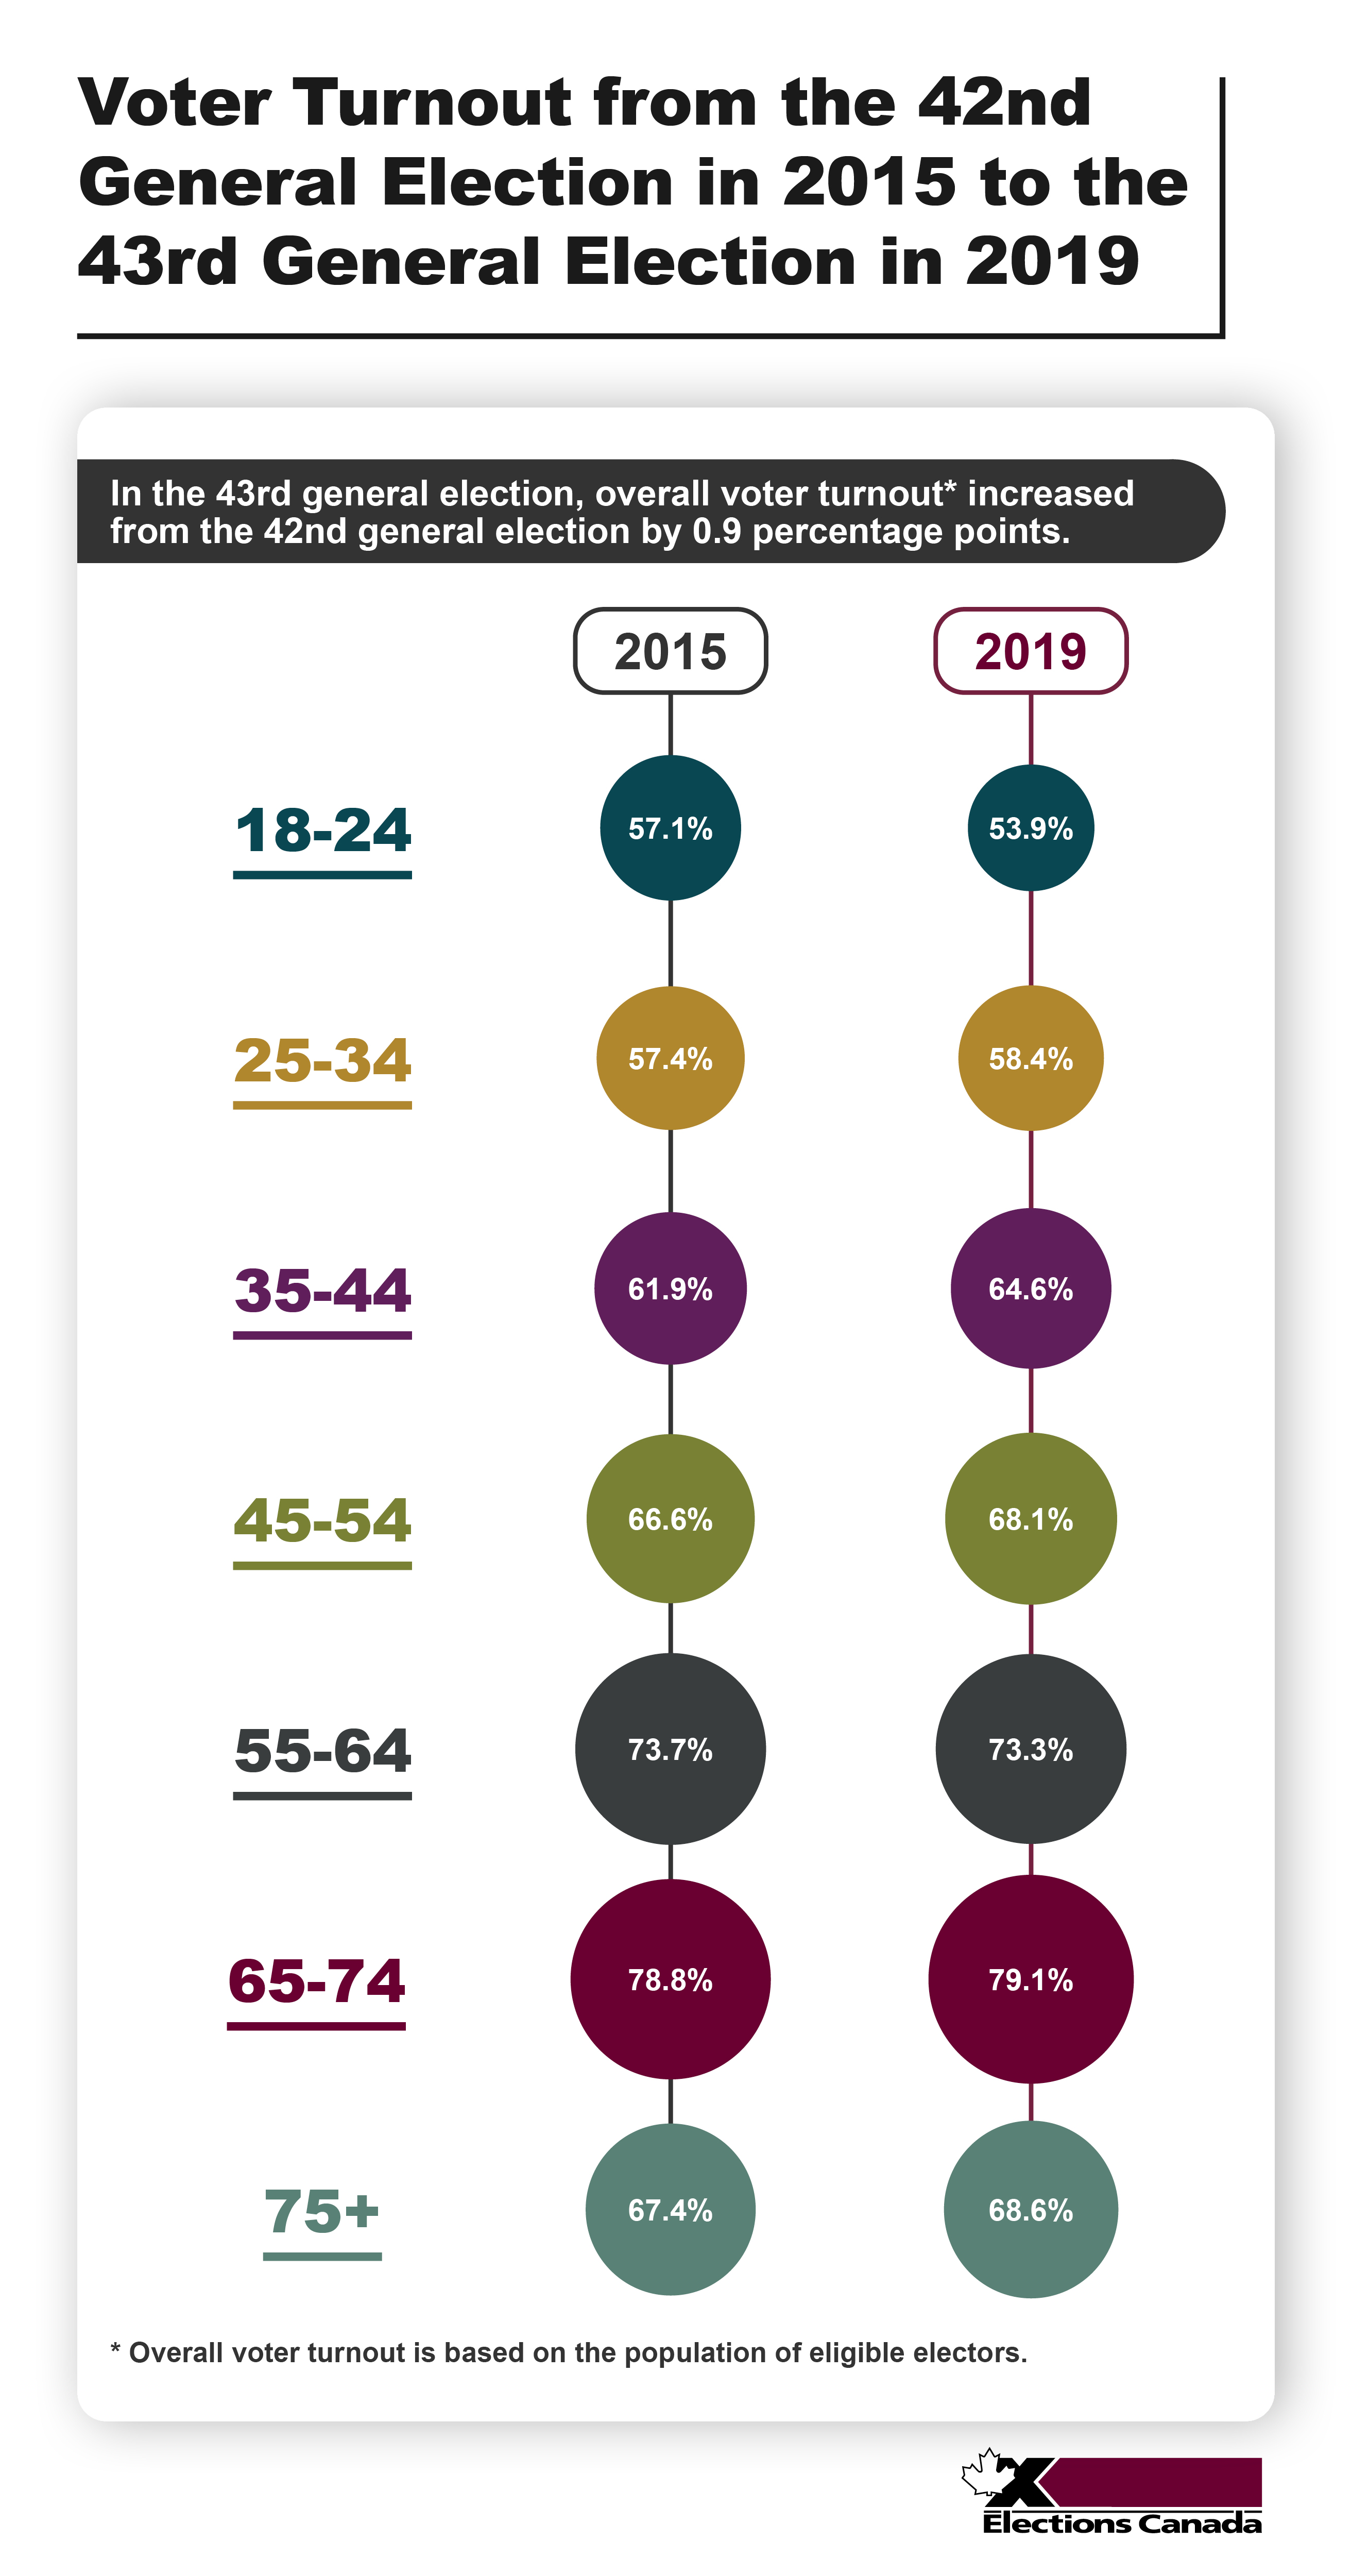
| 2015 | 2019 | |
|---|---|---|
| 18-24 | 57.1% | 53.9% |
| 25-34 | 57.4% | 58.4% |
| 35-44 | 61.9% | 64.6% |
| 45-54 | 66.6% | 68.1% |
| 55-64 | 73.7% | 73.3% |
| 65-74 | 78.8% | 79.1% |
| 75+ | 67.4% | 68.6% |
Footnotes
Return to footnote 1 Overall voter turnout is based on the population of eligible electors.