 Site Menu
Detailed Findings – Report on the Survey of Special Ballot Voters for the 43rd General Election
Electoral Information
Sources of information on option to vote by special ballot
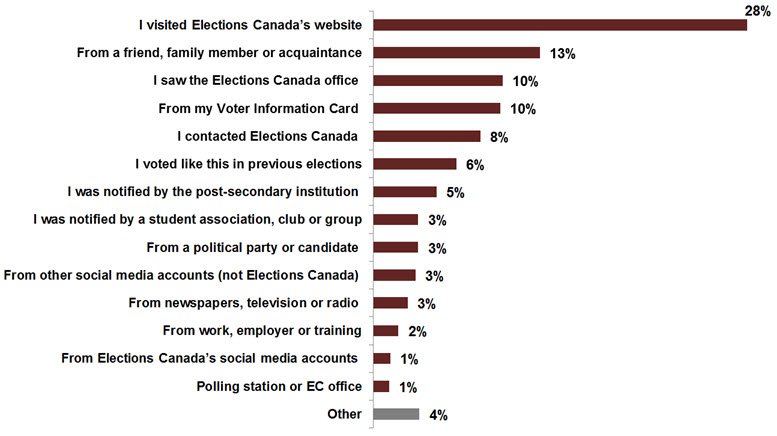
Overall, the most common source of information for finding out about the option to vote by special ballot was the Elections Canada website (28%).
Sources of information on option to vote by special ballotfootnote 1
Text version of "Sources of information on option to vote by special ballot"
The horizontal bar chart above displays the percentage of respondents' sources of information on the option to vote by special ballot. The breakdown is as follows:
- Total
- I visited Elections Canada's website: 28 percent
- From a friend, family member or acquaintance: 13 percent
- I saw the Elections Canada office: 10 percent
- From my Voter Information Card: 10 percent
- I contacted Elections Canada: 8 percent
- I voted like this in previous elections: 6 percent
- I was notified by the post-secondary institution: 5 percent
- I was notified by a student association, club or group: 3 percent
- From a political party or candidate: 3 percent
- From other social media accounts (not Elections Canada): 3 percent
- From newspapers, television or radio: 3 percent
- From work, employer or training: 2 percent
- From Elections Canada's social media accounts: 1 percent
- Polling station or EC office: 1 percent
- Other: 4 percent
For international mail-in voters, the most common sources of information for finding out about the option to vote by special ballot were visiting the Elections Canada website (34%); from a friend, family member or acquaintance (20%); or from non–Elections Canada social media (13%).
The most common sources of information for finding out about the option to vote by special ballot for national mail-in voters were visiting the Elections Canada website (42%) or from a friend, family member or acquaintance (14%).
The most common sources of information for finding out about the option to vote by special ballot for EC office voters were visiting the Elections Canada website (32%); from their voter information card (13%); or from a friend, family member or acquaintance (11%).
For campus voters, the most common sources of information for finding out about the option to vote by special ballot were being notified by their post-secondary institution (23%); being notified by a student association, club or group (18%); or from a friend, family member or acquaintance (14%).
Voting Experience
Reason for voting by special ballot
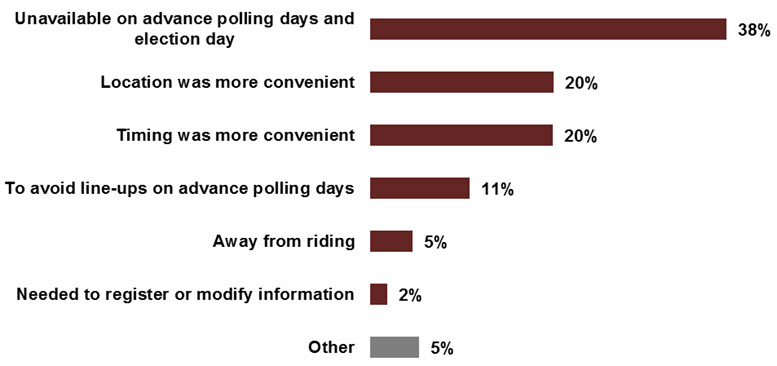
Almost two in five (38%) respondents indicated that the reason they voted by special ballot was because they were unavailable on advance polling days and election day. Other commonly cited reasons had to do with convenience: either the location (20%) or the timing (20%) was more convenient.
Reason for voting by special ballotfootnote 2
Text version of "Reason for voting by special ballot"
The horizontal bar chart above displays the reasons that respondents gave for voting by special ballot. The breakdown is as follows:
- Total
- Unavailable on advance polling days and election day: 38 percent
- Location was more convenient: 20 percent
- Timing was more convenient: 20 percent
- To avoid line-ups on advance polling days: 11 percent
- Away from riding: 5 percent
- Needed to register or modify information: 2 percent
- Other: 5 percent
Voting method
National mail-in and EC office voters were more likely to have voted by special ballot due to being unavailable on advance polling days and election day (41% and 46%, respectively) compared with campus voters (7%).
Campus voters were much more likely to have voted by special ballot due to the location being more convenient (62%) compared with EC office voters (9%).
EC office voters were the most likely to have voted using special ballot to avoid line-ups on advance polling days or election day (12%) compared with campus voters (8%) and national mail-in voters (6%).
Age
Younger voters aged 18 to 24 were more likely to state that they had voted by special ballot because the location was more convenient (53%) compared with older age cohorts, such as those aged 25 to 34 (21%), 35 to 54 (13%), 55 to 74 (8%) and over 75 years (5%).
Voters aged 55 to 74 were more likely to have voted by special ballot because they were unavailable during advance polling days (53%) compared with voters aged 35 to 54 (36%), voters aged 25 to 34 (30%) and voters aged 18 to 24 (11%).
Education
Respondents who had completed high school or less, or who had completed some post-secondary studies or college, were more likely to vote by special ballot due to the location being more convenient (34% and 25%, respectively) compared with respondents who had completed university (12%).
Respondents who had completed some post-secondary studies or college were more likely to vote by special ballot because the timing was more convenient (25%) compared with those who had completed university (15%).
Employment status
Retired respondents were more likely to vote by special ballot because they were unavailable during advance polling days (55%) compared with respondents who were employed (37%), students (14%) or unemployed (5%).
Time it took to vote by mail
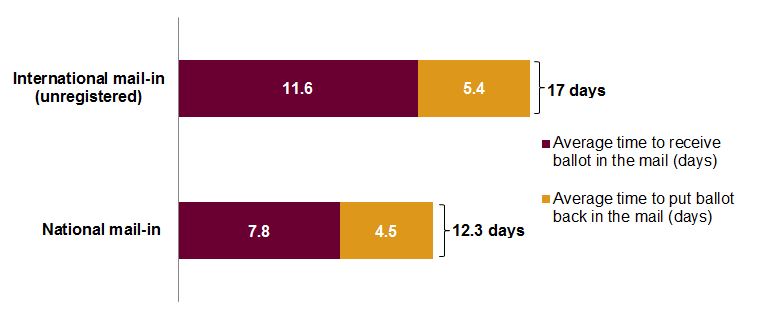
On average, it reportedly took just over one week (7.8 days) for national mail-in voters to receive their ballot in the mail, and it took another 4.5 days to put it back in the mail. In total, this process took almost two weeks (12.3 days).
For international mail-in voters who were not already on the International Register, it reportedly took an average of 11.6 days to receive their ballot in the mail. Then it took another 5.4 days to put the ballot back in the mail. The total process took an average of 17 days. Understandably, this process took, on average, longer than that of national mail-in voters.
For international mail-in voters who were already on the International Register for the 2019 general election, it took them nearly one week (6.8 days), on average, to put their ballot back in the mail once they had received it.footnote 3
These time frames do not include the time that it took for voters to complete the application documentation or the time it took for Elections Canada to receive the ballot in the mail.
Mean wait time for receiving ballot and putting it back in the mailfootnote 4
Text version of "Mean wait time for receiving ballot and putting it back in the mail"
The above horizontal bar chart consists of the following questions:
- Q18: Once you submitted the documentation, how long did it take to receive your ballot in the mail? Base: n = 1274; national and international mail-in voters.
- Q19: Once you received your ballot, how long did it take you to put it back in the mail? Base: n = 1511; national and international mail-in voters.
The above horizontal bar chart displays the average number of days it took a respondent receive their ballot in the mail, and the average number of days to put their ballot back in the mail after receiving it. The breakdown is as follows:
- Total
- International mail-in (unregistered):
- Average time to receive ballot in the mail: 11.6 days
- Average time to put ballot back in the mail: 5.4 days
- Total: 17 days
- National mail-in:
- Average time to receive ballot in the mail: 7.8 days
- Average time to put ballot back in the mail: 4.5 days
- Total: 12.3 days
- International mail-in (unregistered):
Wait time at voting places
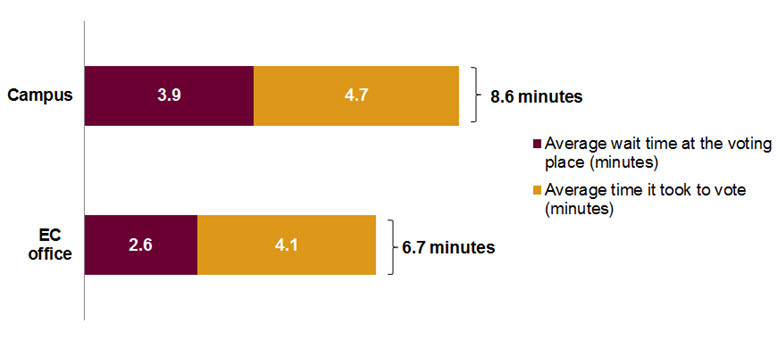
On average, campus voters reportedly waited in line at the EC office for 3.9 minutes, and it took 4.7 minutes to complete the ballot and vote. In total, the average reported voting experience for campus voters was 8.6 minutes.
EC office voters reportedly spent, on average, 2.6 minutes waiting in line at the office, followed by 4.1 minutes to complete the ballot and vote. In total, the average reported voting experience for EC office voters was 6.7 minutes, nearly two minutes (1.9) faster than the wait time for campus voters.
Mean wait time to vote at an EC or campus officefootnote 5
Text version of "Mean wait time to vote at an EC or campus office"
The above horizontal bar chart consists of the following questions:
- Q27: Before an election officer began serving you, how long did you wait at the Elections Canada office? Base: n = 406; EC office voters who voted immediately
- Q28: Once an election officer began serving you, how long did it take to vote? Base: n = 421; EC office voters who voted immediately
- Q29: Before an election officer began serving you, how long did you wait at the Elections Canada office on campus? Base: n = 425; campus voters who voted immediately
- Q30: once an election officer began serving you, how long did it take to vote? Base: n = 439; campus voters who voted immediately
The above horizontal bar chart displays the average amount of time it took respondents to vote before having an election officer serve them. The breakdown is as follows:
- Total
- Campus:
- Average wait time at the voting place: 3.9 minutes
- Average time it took to vote: 4.7 minutes
- Total: 8.6 minutes
- EC office:
- Average wait time at the voting place: 2.6 minutes
- Average time it took to vote: 4.1 minutes
- Total: 6.7 minutes
- Campus:
Ease of completing the ballot
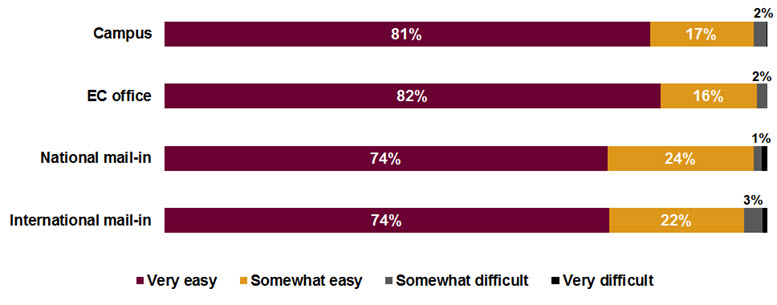
Overall, virtually all voters considered it easy to complete their ballot (98%), claiming that it was either very easy (81%) or somewhat easy (17%).
Ease of completing the ballot remains similar across voting methods. The voters who reportedly faced the most difficulty were international mail-in voters: 4% indicated that completing their ballot was difficult, 3% indicated that it was somewhat difficult, and 1% indicated that it was very difficult.footnote 6
Ease of completing the ballot, by voting methodfootnote 7
Text version of "Ease of completing the ballot, by voting method"
The horizontal bar chart above displays how easy it was for respondents to complete the ballot based on their voting method. The breakdown is as follows:
- Total
- Campus:
- Very easy: 81 percent
- Somewhat easy: 17 percent
- Somewhat difficult: 2 percent
- EC office:
- Very easy: 82 percent
- Somewhat easy: 16 percent
- Somewhat difficult: 2 percent
- National mail-in
- Very easy: 74 percent
- Somewhat easy: 24 percent
- Somewhat difficult: 1 percent
- International mail-in:
- Very easy: 74 percent
- Somewhat easy: 22 percent
- Somewhat difficult: 3 percent
- Campus:
Overall ease of voting
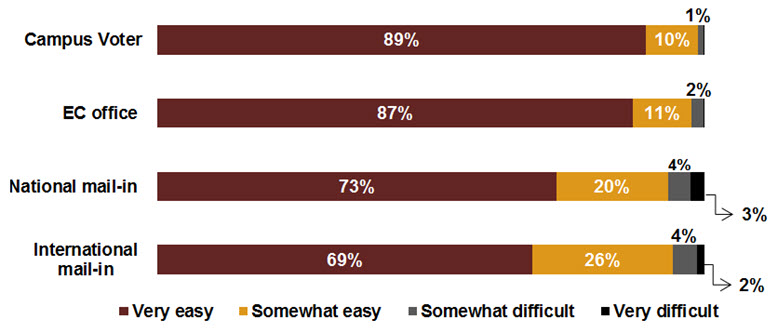
Virtually all (97%) voters found that, overall, the special voting method that they used was easy: 85% of voters found it very easy, and 12% found it somewhat easy.
When considering the different voting methods used, ease of voting remained high; however, international mail-in voters were less likely to say that using that voting method was very easy (69%) compared with campus voters (89%) and EC office voters (87%).footnote 8
Overall ease of voting, by voting methodfootnote 9
Text version of "Overall ease of voting, by voting method"
The horizontal bar chart above displays how easy it was for respondents to use their voting method. The breakdown is as follows:
- Total
- Campus Voter:
- Very easy: 89 percent
- Somewhat easy: 10 percent
- Somewhat difficult: 1 percent
- EC office:
- Very easy: 87 percent
- Somewhat easy: 11 percent
- Somewhat difficult: 2 percent
- National mail-in:
- Very easy: 73 percent
- Somewhat easy: 20 percent
- Somewhat difficult: 4 percent
- Very difficult: 3 percent
- International mail-in:
- Very easy: 69 percent
- Somewhat easy: 26 percent
- Somewhat difficult: 4 percent
- Very difficult: 2 percent
- Campus Voter:
Employment
Retired respondents were more likely to have found that voting by special ballot was very easy (91%) compared with those who were students (83%) or employed (82%).
Difficulty with voting method
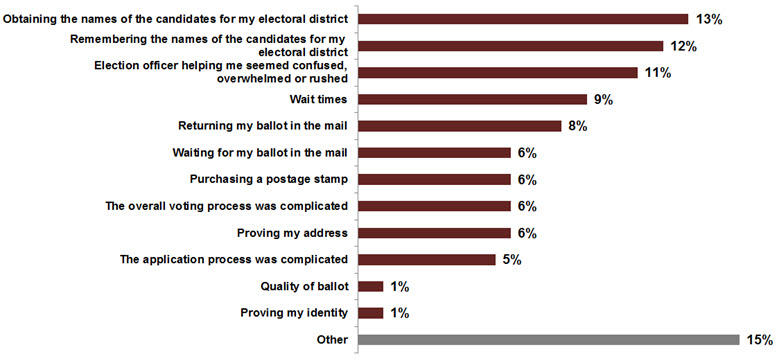
Among respondents who indicated that using the voting method was difficult, the most common difficulty mentioned was obtaining the names of the candidates (13%), and remembering the names of the candidates (12%), for a given electoral district.
Difficulties with the voting method usedfootnote 10
Text version of "Difficulties with the voting method used"
The horizontal bar chart above displays the difficulties that respondents had with their voting method. The Breakdown is as follows:
- Total
- Obtaining the names of the candidates for my electoral district: 13 percent
- Remembering the names of the candidates for my electoral district: 12 percent
- Election officer helping me seemed confused, overwhelmed or rushed: 11 percent
- Wait times: 9 percent
- Returning my ballot in the mail: 8 percent
- Waiting for my ballot in the mail: 6 percent
- Purchasing a postage stamp: 6 percent
- The overall voting process was complicated: 6 percent
- Proving my address: 6 percent
- The application process was complicated: 5 percent
- Quality of ballot: 1 percent
- Proving my identity: 1 percent
- Other: 15 percent
Among national mail-in voters, the most commonly mentioned difficulties were returning their ballot in the mail (18%), waiting for their ballot in the mail (15%) and purchasing a postage stamp (15%).
Similarly, international mail-in voters most commonly cited the following difficulties: returning their ballot in the mail (20%), waiting for their ballot in the mail (16%) and obtaining the names of the candidates for an electoral district (16%).
For EC office voters, common difficulties included remembering the names of the candidates for an electoral district (16%); obtaining the names of the candidates for an electoral district (15%); the election officer serving the voter seemed confused, overwhelmed or rushed (15%); and wait times (15%).
The difficulties faced by campus voters almost exclusively involved the election officer seeming confused, overwhelmed or rushed (55%); and wait times (13%).
Satisfaction with services provided by Elections Canada staff when voting
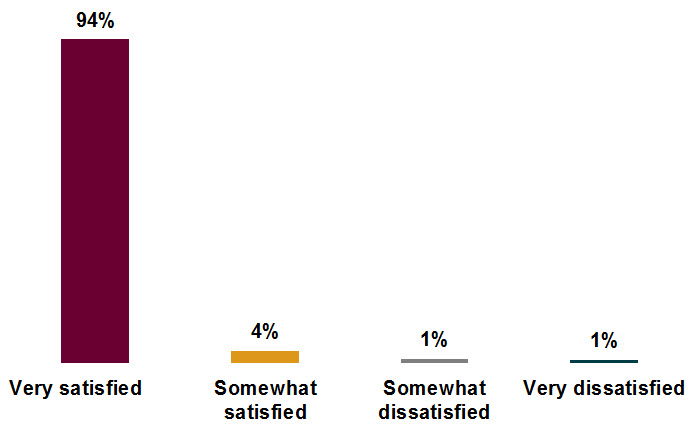
Overall, the survey respondents were satisfied with the services provided to them by election officers. Nearly all respondents (98%) indicated that they were either somewhat or very satisfied with the services provided. Only 2% indicated that they were either somewhat or very dissatisfied with the services provided by Elections Canada staff.
Satisfaction levels across voting method did not differ significantly. Among the EC office voters who were satisfied with the services provided by the election officer, 94% were very satisfied, and 3% were somewhat satisfied.
Among the satisfied respondents who voted on campus, 93% were very satisfied, and 5% were somewhat satisfied.
Overall satisfaction with services provided by election officer(s)footnote 11
Text version of "Overall satisfaction with services provided by election officer(s)"
The vertical bar chart above displays the level of satisfaction of respondents with the services provided by election officer(s). The breakdown is as follows:
- Total
- Very satisfied: 94 percent
- Somewhat satisfied: 4 percent
- Somewhat dissatisfied: 1 percent
- Very dissatisfied: 1 percent
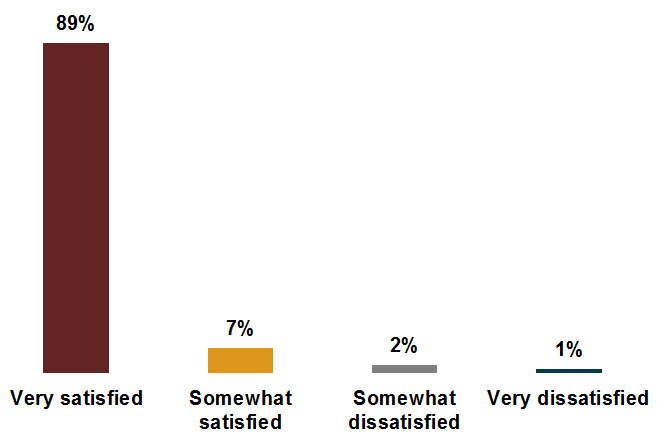
Satisfaction with overall voting experience
Overall, respondents were satisfied with their voting experience (96%), with 89% being very satisfied and 7% somewhat satisfied. Among those who were dissatisfied with their overall voting experience (4%), 2% were somewhat dissatisfied, and 1% were very dissatisfied.footnote 12
Overall satisfaction levels were similar across voting methods. International mail-in voters (94%), national mail-in voters (92%), EC office voters (97%) and campus voters (98%) were either very or somewhat satisfied with their overall voting experience.
Overall satisfaction with voting experiencefootnote 13
Text version of "Overall satisfaction with voting experience"
The vertical bar chart above displays the level of satisfaction of respondents with their voting experience. The breakdown is as follows:
- Total
- Very satisfied: 89 percent
- Somewhat satisfied: 7 percent
- Somewhat dissatisfied: 2 percent
- Very dissatisfied: 1 percent
Voting method
While satisfaction levels were similar across voting method, those who voted on campus were more likely to say that they were very satisfied (91%) compared with both international mail-in (77%) and national mail-in (77%) voters.
Ways Elections Canada can improve services
All respondents were given the opportunity to provide suggestions for ways that Elections Canada can improve its services in the future. In over one-third of cases (38%), respondents took this opportunity to highlight their satisfaction with the voting process instead of providing suggestions for EC services.
One-tenth (10%) of respondents indicated the desire for an online voting service, and 8% wanted more advertising for voting by special ballot.
| How can Elections Canada improve their services in the future?footnote 14 | Percentage of cases, % |
|---|---|
| Offer online voting | 10 |
| More advertising for special voting methods | 8 |
| Provide list of candidates on ballot or in voting kit | 7 |
| Improve training for staff | 4 |
| More signs to make polling place visible | 4 |
| Complaints about envelopes or ballots | 3 |
| Provide paid postage | 3 |
| Make voting more accessible | 2 |
| Complaints or suggestions regarding the Elections Canada website | 2 |
| Voting process slow or wait times are too long | 2 |
| Concerns regarding secrecy or security of voting method | 1 |
| Reduce time to receive ballot | 1 |
| Simplify the voting process (too complicated) | 1 |
| Allow for voting places abroad, at embassies or consulates | 1 |
| Otherfootnote 15 | 22 |
Would have voted otherwise
Overall, one-third (34%) of campus, EC office and national mail-in respondents said that they would not have voted at all had it not been for the option to vote by special ballot.
Would have voted at all, by voting methodfootnote 16
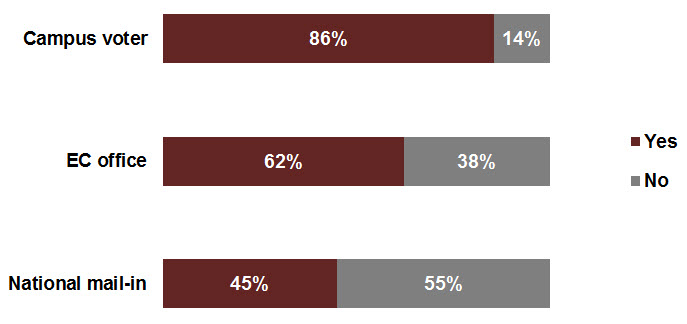
Text version of "Would have voted at all, by voting method"
The horizontal bar chart above displays the percentage of respondents that would have voted otherwise if they had not been able to use that voting method. The breakdown is as follows:
- Total
- Campus voter:
- Yes: 86 percent
- No: 14 percent
- EC office:
- Yes: 62 percent
- No: 38 percent
- National mail-in:
- Yes: 45 percent
- No: 55 percent
- Campus voter:
Voting method
If they had been unable to vote by special ballot, national mail-in voters were most likely to say that they would not have voted at all (55%) compared with EC office voters (38%) and campus voters (14%).
Age
Voters aged 18 to 24 were more likely to state that they would have voted if they had not been able to use this voting method: 82% claimed that they would have voted using another method. This compares with 66% of voters aged 25 to 34, 65% of voters aged 35 to 54, 59% of voters aged 55 to 74 and 60% of voters aged 75 and over.
Voted in 2015
Respondents who voted in the 2015 general election (64%) were much more likely to say that if they could not have voted by special ballot, they would have voted using another method compared with those who did not vote in 2015 (36%).
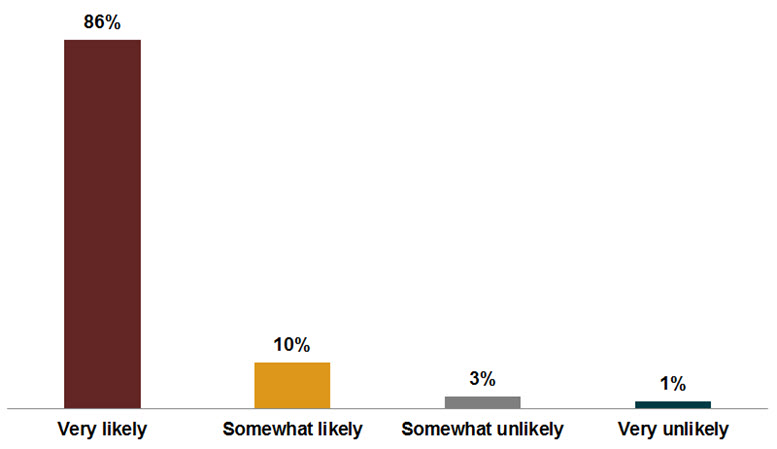
Likelihood of recommending special ballot voting to others
Nearly all (96%) respondents were either very or somewhat likely to recommend voting by special ballot to others.footnote 17
Text version of "Nearly all (96%) respondents were either very or somewhat likely to recommend voting by special ballot to others."
The vertical bar chart above displays the percentage of respondents that are likely to recommend this voting method to friends and family. The breakdown is as follows:
- Total
- Very likely: 86 percent
- Somewhat likely: 10 percent
- Somewhat unlikely: 3 percent
- Very unlikely: 1 percent
Voting method
Nearly all (96%) international mail-in voters were either very or somewhat likely to recommend special ballot voting.
Among national mail-in voters who were likely to recommend special ballot voting to someone, 77% claimed that they were very likely, and 18% indicated that they were somewhat likely, to do so. Only 3% of national mail-in voters stated that they were somewhat unlikely, and 3% were very unlikely, to recommend the option to others.
Nearly all (96%) respondents who voted at an EC office were either very or somewhat likely to recommend special ballot voting.
Virtually all (99%) campus voters were either very or somewhat likely to recommend special ballot voting to others.
Perception of secrecy of the ballot
Overall, virtually all (99%) respondents agreed that the secrecy of their ballot was protected during the voting process, with 94% stating that they strongly agreed and 5% stating that they somewhat agreed. Only 1% of respondents disagreed that the secrecy of their ballot was protected during the voting process.
Perception of the secrecy of the ballot during the voting processfootnote 18
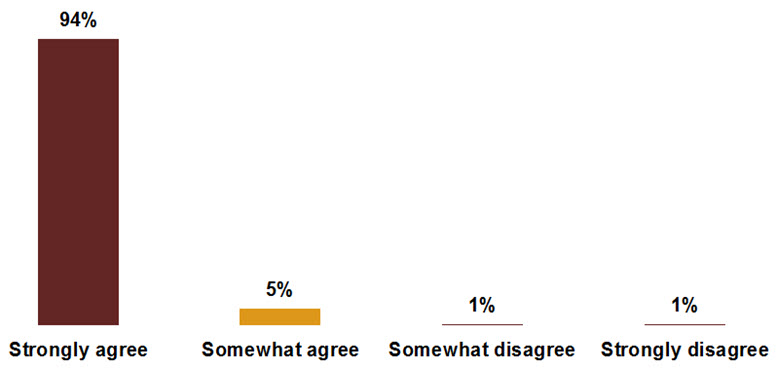
Text version of "Perception of the secrecy of the ballot during the voting process"
The vertical bar chart above displays the percentage of respondents that perceive that the secrecy of their voted was protected during the voting process: The breakdown is as follows:
- Total
- Strongly agree: 94 percent
- Somewhat agree: 5 percent
- Somewhat disagree: 1 percent
- Strongly disagree: 1 percent
Voting method
International mail-in and national mail-in voters were less likely to strongly agree that the secrecy of their vote was protected during the voting process (81% and 85%, respectively) compared with campus voters (95%) and EC office voters (94%).
Reason Unable to Vote by Special Ballot
Of all respondents, only 4% had not successfully returned their ballot. Among those who had been unable to cast their ballot, the most common reason provided for not being able to do so was among national and international mail-in electors, who could not mail in their ballot to Elections Canada by the deadline (33%).
Main reason unable to votefootnote 19
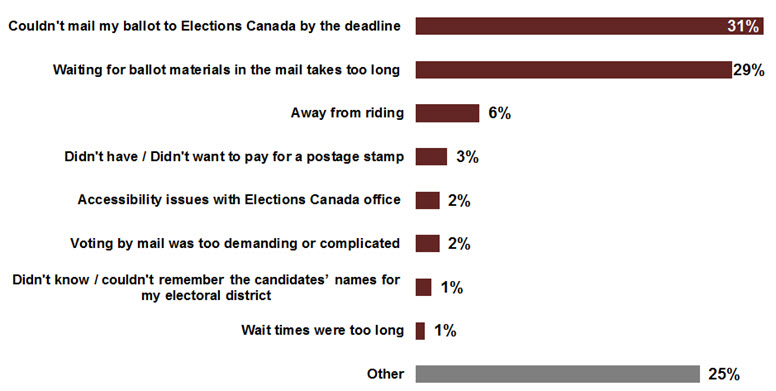
Text version of "Main reason unable to vote"
The horizontal bar chart above displays the main reasons that respondents gave for not being able to vote. The breakdown is as follows:
- Total
- Couldn't mail my ballot to Elections Canada by the deadline: 31 percent
- Waiting for ballot materials in the mail takes too long: 29 percent
- Away from riding: 6 percent
- Didn't have / Didn't want to pay for a postage stamp: 3 percent
- Accessibility issues with Elections Canada office: 2 percent
- Voting by mail was too demanding or complicated: 2 percent
- Didn't know / couldn't remember the candidates' names for my electoral district: 1 percent
- Wait times were too long: 1 percent
- Other: 25 percent
Footnotes
-
Return to footnote 1 Q.11–14. How did you find out you could use that voting method? Base: n = 3,339: voters.
-
Return to footnote 2 Q15. What is the main reason you decided to use that voting method? Base n = 1,454: asked of national mail-in, EC office and campus voters.
-
Return to footnote 3 Q20: Once you received your ballot, how long did it take you to put it back in the mail? Base: n = 541: international mail-in voters who were already on the International Register. Note: The average time to receive the ballot in the mail for electors on the International Register is not included. This depends on when the ballots were mailed out by Elections Canada and received by electors, which is unknown.
-
Return to footnote 4 This graph consists of the following questions:
- Q18: Once you submitted the documentation, how long did it take to receive your ballot in the mail? Base: n = 1,274: national and international mail-in voters.
- Q19: Once you received your ballot, how long did it take you to put it back in the mail? Base: n = 1,511: national and international mail-in voters.
-
Return to footnote 5 This graph consists of the following questions:
- Q27: Before an election officer began serving you, how long did you wait at the EC office? Base: n = 406: EC office voters who voted immediately.
- Q28: Once an election officer began serving you, how long did it take to vote? Base: n = 421: EC office voters who voted immediately.
- Q29: Before an election officer began serving you, how long did you wait at the EC office on campus? Base: n = 425; campus voters who voted immediately.
- Q30: Once an election officer began serving you, how long did it take to vote? Base: n = 439: campus voters who voted immediately.
-
Return to footnote 6 The graph does not display figures less than 1%, which fall into the "Very difficult" category.
-
Return to footnote 7 Q58. More specifically, would you say that completing the ballot was … Base: n = 3,339: voters.
-
Return to footnote 8 The graph does not display figures less than 1%, which fall into the "Very difficult" category.
-
Return to footnote 9 Q52. Overall, would you say that using that voting method was … Base: n = 3,339: voters.
-
Return to footnote 10 Q53–57. What did you find difficult about the voting method you used? Multiple responses. Base: n = 168: respondents who said that using the voting method was somewhat or very difficult.
-
Return to footnote 11 Q62. Overall, how satisfied are you with the services provided by the election officer(s)? Base: n = 1,136: respondents who interacted with an election officer, either when receiving or when returning their ballot.
-
Return to footnote 12 Note: due to rounding, figures may not add up to combined categories.
-
Return to footnote 13 Q61. Overall, how satisfied were you with your voting experience? Base: n = 3,339: voters.
-
Return to footnote 14 How can Elections Canada improve their services in the future? Open-ended question asked at the end of the survey. Base: n = 3,514: all respondents. Percentages in the table reflect the proportion of cases.
-
Return to footnote 15 "Other" category includes suggestions that did not contain enough common responses to form a new category; it accounted for at least 1% of responses.
-
Return to footnote 16 Q16. If you had not been able to use that voting method, would you have voted otherwise? Base: n = 1,200: national mail-in voters, campus voters, EC office voters. International voters were not asked Q16.
-
Return to footnote 17 Q63. Based on your experience, how likely are you to recommend this voting method to friends and family? Base: n = 3,339: voters.
-
Return to footnote 18 Q64. The secrecy of my vote was protected during the voting process. Base: n = 3,339: voters.
-
Return to footnote 19 Q67–69. What is the main reason you were unable to vote? Base: n = 140: those who did not return their ballot. The data for these questions are unweighted.