 Site Menu
Detailed Findings – Report on the Survey of Outreach Stakeholders for the 43rd General Election
Community groups served
Most outreach stakeholders aimed to reach more than one community. When asked which group(s) they were aiming to reach with their activities, the 44 respondents made 127 selections in total; about three community groups each, on average. The most commonly selected group was youth (selected by 26 organizations) followed by Canadians with disabilities (selected by 19 organizations).
Some organizations (13) identified groups beyond those listed, including the following: electors with low literacy levels; electors with intellectual disabilities; electors living in poverty; Jewish electors; and politically disengaged electors.
Figure 1. Groups stakeholders aimed to reach
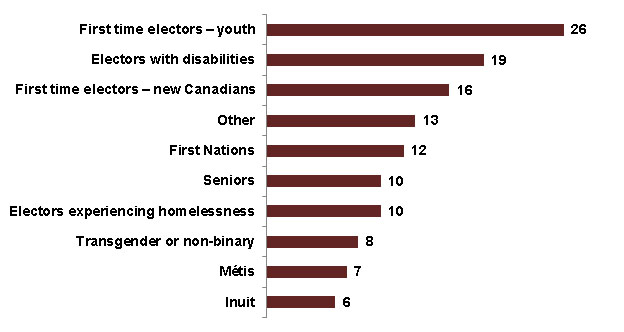
Question 1: What group(s) were you aiming to reach with your activities?
Base: All respondents (n=44)
Text description of "Figure 1. Groups stakeholders aimed to reach"
Question 1: What group(s) were you aiming to reach with your activities? Multiple response option. Base: All respondents (n=44).
The horizontal bar chart displays the various types of community groups that stakeholder organizations aimed to reach with their outreach efforts. The breakdown is as follows:
First-time electors youth: 26
Electors with disabilities: 19
First-time electors new Canadians: 16
Other: 13
First Nations: 12
Seniors: 10
Electors experiencing homelessness: 10
Transgender or non-binary: 8
Métis: 7
Inuit: 6
Some respondents (13 out of 44) said that certain groups or regions were more difficult to reach than others. Overcoming the barriers of remote geography and figuring out how to successfully reach out to youth were the two most common challenges.
Knowledge of the electoral process
Knowledge of barriers
Stakeholders felt confident about their knowledge of the barriers faced by the group(s) they serve. The vast majority (41 out of 44) agreed that their organization was well-informed, as of election day, about the barriers the group(s) they worked with may face when participating in the electoral process (29 strongly). The remaining three respondents somewhat disagreed.
Figure 2. Level of agreement that stakeholder was well-informed about barriers to electoral process
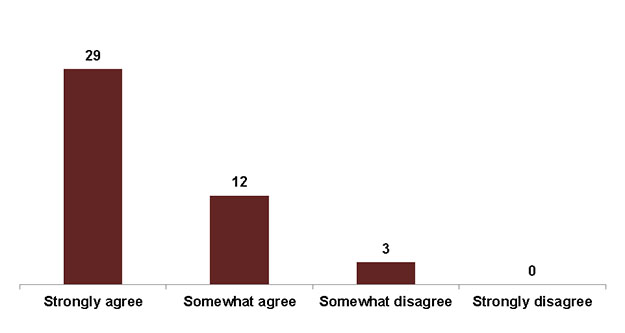
Question 6: How much do you agree or disagree with the following statement? "As of election day, my organization was well-informed about the barriers the group(s) we work with may face when participating in the electoral process."
Base: All respondents (n=44)
Text description of "Figure 2. Level of agreement that stakeholder was well-informed about barriers to electoral process"
Question 6: How much do you agree or disagree with the following statement? "As of election day, my organization was well-informed about the barriers the group(s) we work with may face when participating in the electoral process." Base: All respondents (n=44).
The vertical bar chart shows respondents' reported level of agreement about whether their organization was well-informed about barriers to participating in the electoral process. The breakdown is as follows:
Total
Strongly agree: 29
Somewhat agree: 12
Somewhat disagree: 3
Strongly disagree: 0
Knowledge of the electoral process
The vast majority of stakeholders (40 out of 44) also agreed that the group(s) they work with were knowledgeable about various elements of the electoral process, such as when, where and the ways to register and vote (ten strongly), while the remaining four somewhat disagreed.
Figure 3. Level of agreement that group(s) were well informed on when, where and the ways to register and vote
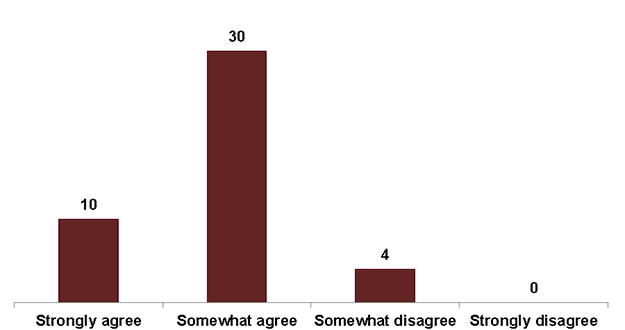
Question 4: How much do you agree or disagree with the following statement? "As of election day, the group(s) we work with were well-informed about when, where and the ways to register and vote."
Base: All respondents (n=44)
Text description of "Figure 3. Level of agreement that group(s) were well informed on when, where and the ways to register and vote"
Question 4: How much do you agree or disagree with the following statement? "As of election day, the group(s) we work with were well-informed about when, where and the ways to register and vote." Base: All respondents (n=44).
The vertical bar chart shows respondents' reported level of agreement about whether the group(s) they work with were well-informed about when, where and the ways to register and vote. The breakdown is as follows:
Total
Strongly agree: 10
Somewhat agree: 30
Somewhat disagree: 4
Strongly disagree: 0
Accessing information
Similarly, when it came to knowing where to go for information on the electoral process, stakeholders felt that community groups were well informed. The vast majority (39 out of 44) agreed with the statement "as of election day, the group(s) we work with knew where to go for information on the electoral process" (15 strongly), whereas five respondents somewhat disagreed.
Figure 4. Level of agreement that group(s) knew where to go for information on the electoral process
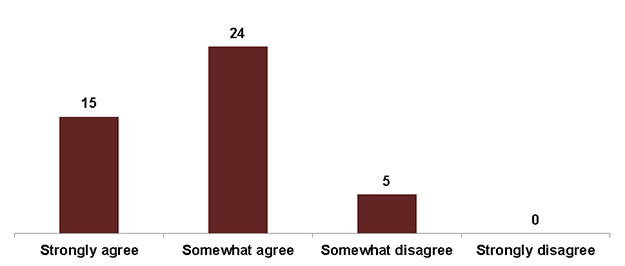
Question 5: How much do you agree or disagree with the following statement? "As of election day, the group(s) we work with knew where to go for information on the electoral process."
Base: All respondents (n=44)
Text description of "Figure 4. Level of agreement that group(s) knew where to go for information on the electoral process"
Question 5: How much do you agree or disagree with the following statement? "As of election day, the group(s) we work with knew where to go for information on the electoral process." Base: All respondents (n=44).
The vertical bar chart shows respondents' reported level of agreement about whether the group(s) they work with knew where to go for information on the electoral process. The breakdown is as follows:
Total
Strongly agree: 15
Somewhat agree: 24
Somewhat disagree: 5
Strongly disagree: 0
The official source of information about the electoral process
When asked to name the organization that is the most official source of information about the electoral process, most respondents (37 out of 44) identified EC. Of the remaining seven respondents, four said that they didn't know and three named other organizations.
Figure 5. Number of stakeholders that named Elections Canada as the most official source of information about the electoral process
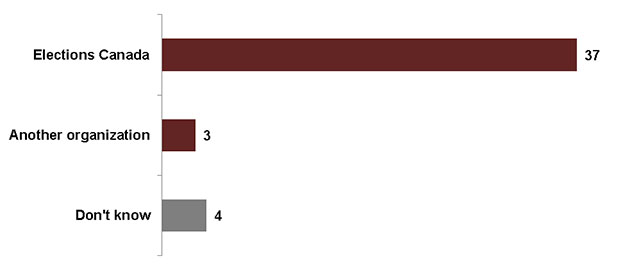
Question 7: What organization is the most official source of information about the electoral process?
Base: All respondents (n=44)
Text description of "Figure 5. Number of stakeholders that named Elections Canada as the most official source of information about the electoral process"
Question 7: What organization is the most official source of information about the electoral process? Base: All respondents (n=44).
The horizontal bar chart displays the number of respondents who named Elections Canada rather than another organization as the most official source of information about the electoral process. The breakdown is as follows:
Total
Elections Canada: 37
Another organization: 3
Don't know: 4
Knowledge and use of Inspire Democracy resources
Inspire Democracy election toolkits
The vast majority of stakeholders (39 out of 44) were familiar with one or more of the Inspire Democracy toolkits, and most respondents (28 out of 44) were familiar with at least two of the toolkits.
The most well-recognized toolkit was Registering and Voting in a Federal Election (39 of the 44 respondents were familiar), followed by Working at a Federal Election (27 of 44 were familiar) and lastly Running in a Federal Election (18 of 44 were familiar). There were five respondents who were not familiar with any of the toolkits.
Figure 6. Number of stakeholders familiar with each of the Inspire Democracy toolkits
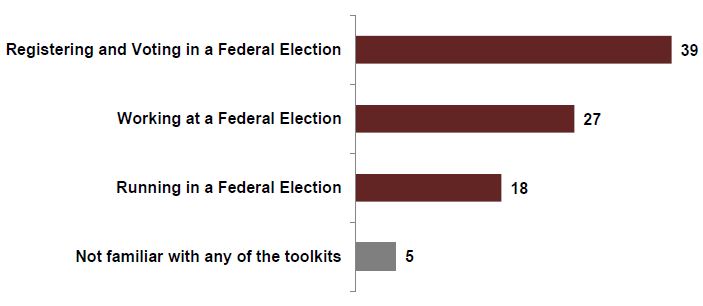
Question 8: Are you familiar with the following Inspire Democracy election toolkits? Check all that apply.
Base: All respondents (n=44)
Text description of "Figure 6. Number of stakeholders familiar with each of the Inspire Democracy toolkits"
Question 8: Are you familiar with the following Inspire Democracy election toolkits? Check all that apply. Multiple response option. Base: All respondents (n=44).
The horizontal bar chart displays the number of respondents who are familiar with each of the three Inspire Democracy toolkits or not familiar with any of the toolkits. The breakdown is as follows:
Total
Registering and Voting in a Federal Election: 39
Working at a Federal Election: 27
Running in a Federal Election: 18
Not familiar with any of the toolkits: 5
Registering and Voting in a Federal Election
Most respondents were satisfied with the toolkits with which they were familiar. This was particularly true for the Registering and Voting in a Federal Election toolkit where virtually all respondents (37 of 39) were satisfied (24 very satisfied). The remaining two respondents were somewhat dissatisfied with the toolkit. Reasons for their dissatisfaction included the document length, which the respondent felt was overly long, and the inflexible PDF format. The latter comment was mentioned for each of the three toolkits.
Figure 7. Level of satisfaction with the Registering and Voting in a Federal Election Toolkit
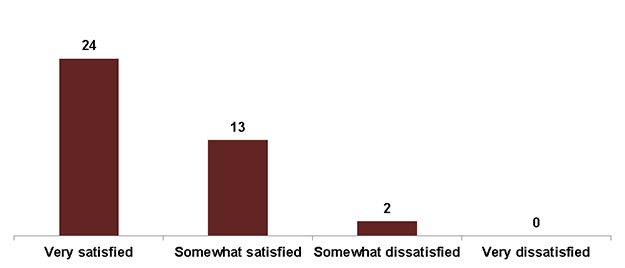
Question 9: How satisfied were you with the Registering and Voting in a Federal Election toolkit?
Base: Respondents familiar with the Registering and Voting in a Federal Election toolkit (n=39)
Text description of "Figure 7. Level of satisfaction with the Registering and Voting in a Federal Election Toolkit"
Question 9: How satisfied were you with the Registering and Voting in a Federal Election toolkit? Base: Respondents familiar with the Registering and Voting in a Federal Election toolkit (n=39).
The vertical bar chart shows respondents' reported level of satisfaction with the Registering and Voting in a Federal Election toolkit. The breakdown is as follows:
Total
Very satisfied: 24
Somewhat satisfied: 13
Somewhat dissatisfied: 2
Very dissatisfied: 0
Working at a Federal Election
The majority of respondents who were familiar with the Working at a Federal Election toolkit were also satisfied; 21 of 27 respondents were satisfied with that toolkit (14 were very satisfied). There were two respondents who were somewhat dissatisfied with it, and four respondents said that they didn't know. For the two respondents who reported dissatisfaction, in addition to the aforementioned concern about the inflexible PDF format, one respondent said that they thought this toolkit did not apply easily to their particular community's setting.
Figure 8. Level of satisfaction with the Working at a Federal Election toolkit
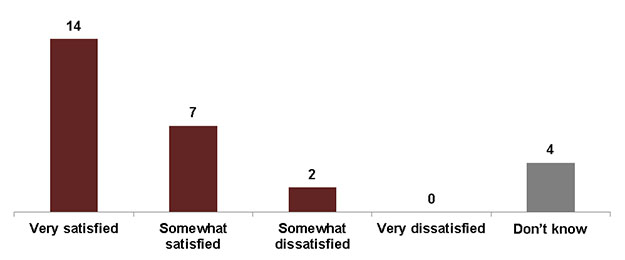
Question 11: How satisfied were you with the Working at a Federal Election toolkit?
Base: Respondents familiar with the Working at a Federal Election toolkit (n=27)
Text description of "Figure 8. Level of satisfaction with the Working at a Federal Election toolkit"
Question 11: How satisfied were you with the Working at a Federal Election toolkit? Base: Respondents familiar with the Working at a Federal Election toolkit (n=27).
The vertical bar chart shows respondents' reported level of satisfaction with the Working at a Federal Election toolkit. The breakdown is as follows:
Total
Very satisfied: 14
Somewhat satisfied: 7
Somewhat dissatisfied: 2
Very dissatisfied: 0
Don't know: 4
Running in a Federal Election
While fewer respondents were familiar with the Running in a Federal Election toolkit, most of them (11 out of 18) were satisfied with it (seven very satisfied). A number of respondents (five) said they didn't know, which may suggest it was not as heavily used as the other toolkits. The two respondents who were somewhat dissatisfied identified a lack of relevance to their group's work and, again, the inflexible PDF format as reasons for their dissatisfaction.
Figure 9. Level of satisfaction with the Running in a Federal Election toolkit
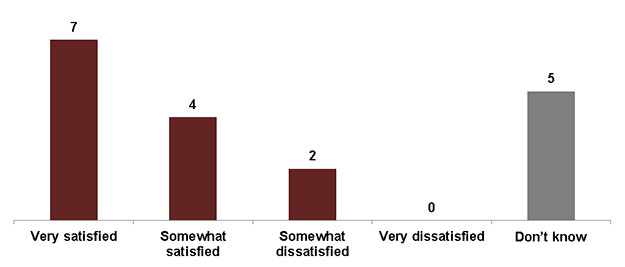
Question 13: How satisfied were you with the Running in a Federal Election toolkit? Base: Respondents familiar with the Running in a Federal Election toolkit (n=18).
Text description of "Figure 9. Level of satisfaction with the Running in a Federal Election toolkit"
Question 13: How satisfied were you with the Running in a Federal Election toolkit? Base: Respondents familiar with the Running in a Federal Election toolkit (n=18).
The vertical bar chart shows respondents' reported level of satisfaction with the Running in a Federal Election toolkit. The breakdown is as follows:
Total
Very satisfied: 7
Somewhat satisfied: 4
Somewhat dissatisfied: 2
Very dissatisfied: 0
Don't know: 5
Knowledge of alternative formats
Most stakeholders (36 out of 44) were aware that EC's materials are available in alternative formats and languages other than English and French. However, seven respondents were not aware of these alternative formats and languages and one didn't know. Of the seven that were not aware, six organizations served one or more groups that might have benefited from access to an alternative format (e.g. Indigenous electors, electors with disabilities, and/or new Canadians).
Figure 10. Number of stakeholders aware of alternative formats and/or languages
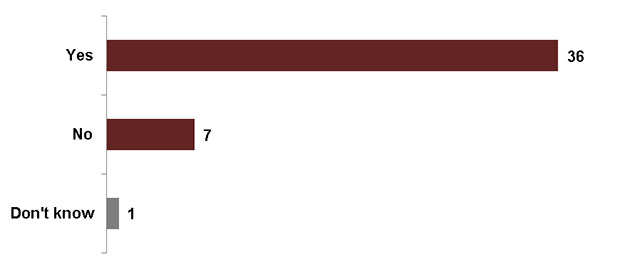
Question 15: Many of Elections Canada's materials are available in multiple formats and many different languages. Were you aware that there are different formats and languages other than English and French available?
Base: All respondents (n=44)
Text description of "Figure 10. Number of stakeholders aware of alternative formats and/or languages"
Question 15: Many of Elections Canada's materials are available in multiple formats and many different languages. Were you aware that there are different formats and languages other than English and French available? Base: All respondents (n=44).
The horizontal bar chart displays the number of respondents who were aware that many of Elections Canada's materials are available in multiple formats and/or languages other than English and French. The breakdown is as follows:
Total
Yes: 36
No: 7
Don't know: 1
Use of alternative formats
Many of the respondents who were aware of the alternative formats and languages chose to use those resources (21 out of 36), whereas 13 respondents did not use them and two didn't know. Of the 13 that did not use the alternative formats and languages, eight organizations served one or more groups that might have benefited from access to an alternative format (e.g. Indigenous electors, electors with disabilities, and/or new Canadians).
Figure 11. Number of Stakeholders that used alternative formats and/or languages
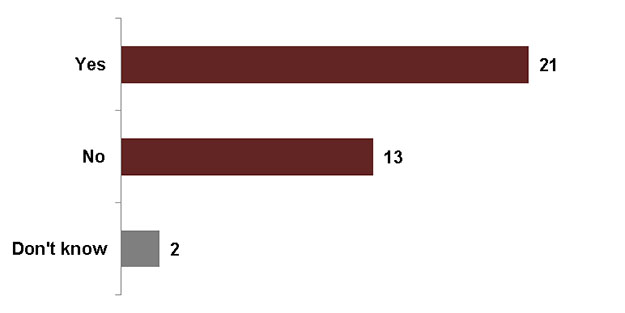
Question 16: Did your organization use any materials in any of these alternative formats and/or in any language other than English and French? Base: Respondents who were aware of alternative formats and languages (n=36)
Text description of "Figure 11. Number of Stakeholders that used alternative formats and/or languages"
Question 16: Did your organization use any materials in any of these alternative formats and/or in any language other than English and French? Base: Respondents who were aware of alternative formats and languages (n=36).
The horizontal bar chart displays the number of respondents who used one or more of Elections Canada's materials in an alternative format and/or language other than English and French. The breakdown is as follows:
Total
Yes: 21
No: 13
Don't know: 2
The 21 respondents who used one or more of those alternative formats said that they used a wide variety of the options available. Many languages were named, including many Indigenous languages, Mandarin, Korean, Arabic, Farsi, German, Somalian, Spanish, Urdu, Tagalog, Bengali, Tamil, Hebrew and Yiddish. Alternative formats named included braille, large print, captioned videos, audio CD formats, and plain language materials.
Helpfulness of Inspire Democracy resources
Stakeholders reported that they found Inspire Democracy's resources to be helpful, both to reduce barriers and to inform the groups they work with about when, where and the various ways to register and vote.
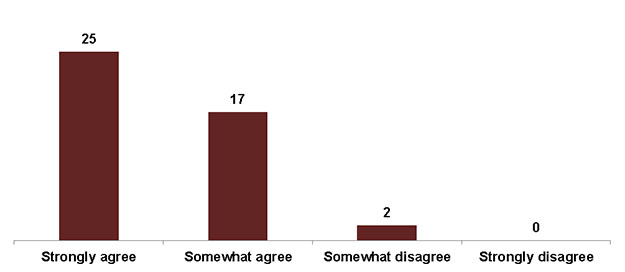
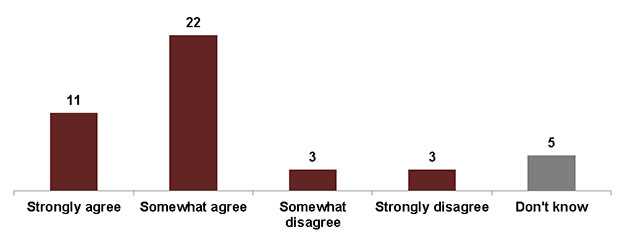
The vast majority of respondents (39 out of 44) agreed that Inspire Democracy resources helped them to reduce barriers to participating in the electoral process (22 strongly), whereas four respondents disagreed (one strongly), and one didn't know.
Figure 12. Level of agreement that Inspire Democracy resources helped to reduce barriers
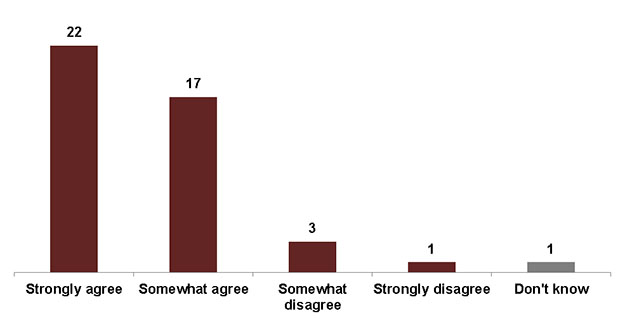
Question 18: How much do you agree or disagree with the following statement? "Inspire Democracy resources helped us reduce barriers to participating in the electoral process for the group(s) we work with." Base: All respondents (n=44)
Text description of "Figure 12. Level of agreement that Inspire Democracy resources helped to reduce barriers"
Question 18: How much do you agree or disagree with the following statement? "Inspire Democracy resources helped us reduce barriers to participating in the electoral process for the group(s) we work with." Base: All respondents (n=44).
The vertical bar chart shows respondents' reported level of agreement about whether Inspire Democracy resources helped their organization to reduce barriers to participating in the electoral process for the group(s) they work with. The breakdown is as follows:
Total
Strongly agree: 22
Somewhat agree: 17
Somewhat disagree: 3
Strongly disagree: 1
Don't know: 1
When it came to the question of whether Inspire Democracy resources helped groups to be better informed on when, where and the various ways to register and vote, virtually all respondents (42 out of 44) agreed that they did (25 strongly), whereas two respondents somewhat disagreed.
Figure 13. Level of agreement that Inspire Democracy resources helped groups to be better informed on registering and voting
Question 19: How much do you agree or disagree with the following statement? "Inspire Democracy resources helped the group(s) we work with to be better informed on when, where and the various ways to register and vote." Base: All respondents (n=44)
Text description of "Figure 13. Level of agreement that Inspire Democracy resources helped groups to be better informed on registering and voting"
Question 19: How much do you agree or disagree with the following statement? "Inspire Democracy resources helped the group(s) we work with to be better informed on when, where and the various ways to register and vote." Base: All respondents (n=44).
The vertical bar chart shows respondents' reported level of agreement that Inspire Democracy resources helped their organization to be better informed on registering and voting. The breakdown is as follows:
Total
Strongly agree: 25
Somewhat agree: 17
Somewhat disagree: 2
Strongly disagree: 0
Sharing Inspire Democracy resources
The vast majority of stakeholders (38 out of 44) opted to share information on the electoral process in their newsletters and/or social media posts, and many who did so shared Inspire Democracy resources (26 out of 38). In terms of frequency, most of the 26 said that they shared those resources once or twice (12), or weekly (11).
Figure 14. Number of stakeholders that shared Inspire Democracy resources in their newsletters and/or social media
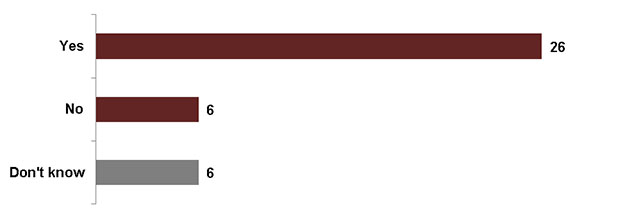
Question 21: Did any of the information you shared come from Inspire Democracy resources? Base: Respondents who opted to share information on the electoral process in their newsletters and/or social media posts (n=38)
Text description of "Figure 14. Number of stakeholders that shared Inspire Democracy resources in their newsletters and/or social media"
Question 21: Did any of the information you shared come from Inspire Democracy resources? Base: Respondents who opted to share information on the electoral process in their newsletters and/or social media posts (n=38).
The horizontal bar chart displays the number of respondents whose organization shared Inspire Democracy resources in their newsletters and/or on their social media. The breakdown is as follows:
Total
Yes: 26
No: 6
Don't know: 6
Requests for Inspire Democracy kiosks, workshops and presentations
When asked whether they requested an Inspire Democracy kiosk, workshop or presentation, 16 out of 44 stakeholders responded that they had. Of those, all 16 were satisfied with that kiosk, workshop or presentation (12 were very satisfied).
Figure 15. Level of satisfaction with Inspire Democracy kiosk, workshop and/or presentation
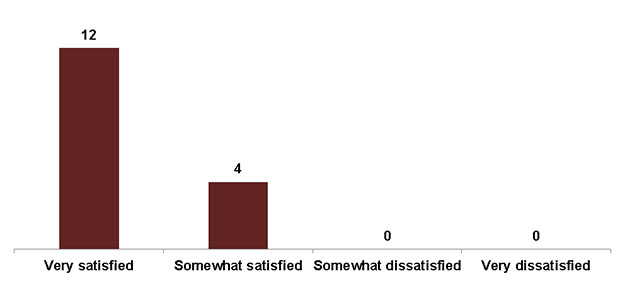
Question 24: How satisfied were you with that kiosk, workshop or presentation? Base: Respondents from organizations that requested an Inspire Democracy kiosk, workshop or presentation (n=16)
Text description of "Figure 15. Level of satisfaction with Inspire Democracy kiosk, workshop and/or presentation"
Question 24: How satisfied were you with that kiosk, workshop or presentation? Base: Respondents from organizations that requested an Inspire Democracy kiosk, workshop or presentation (n=16).
The vertical bar chart shows respondents' reported level of satisfaction with the Inspire Democracy kiosk, workshop and/or presentation hosted by their organization. The breakdown is as follows:
Total
Very satisfied: 12
Somewhat satisfied: 4
Somewhat dissatisfied: 0
Very dissatisfied: 0
Information gaps and resources created
Information gaps
A few respondents (nine out of 44) felt that the groups they worked with were still missing information about the electoral process as of election day. Examples of information they thought was still missing for some electors included the following:
- information about ID (particularly if an elector is missing ID or is experiencing homelessness);
- further clarification about advance voting;
- clarification for first time electors about registering; and
- how to notify Elections Canada about a name change (particularly for trans and non-binary electors).
Resources created by stakeholders
In response to some of these gaps and to share more targeted information with their membership, about three quarters of stakeholders (33 out of 44) created their own resources. Examples of the resources they created included the following:
- written materials such as newsletters, guides, articles, flyers, postcards, toolkits, one pagers, mock platforms and plain language resources;
- visual materials such as displays, posters, buttons, infographics, and t-shirts;
- training materials and opportunities such as webinars, presentations, and workshops;
- networks, such as the "Making Voices Count" coalition; and
- events, such as organizing a local candidates debate.
Some of the resources developed were made available to the wider stakeholder network on the Inspire Democracy website (e.g. Vote PopUp). Just over half of stakeholders (25 out of 44) said that they made use of one or more of these shared resources developed by other organizations.
Stakeholder perceptions of the electoral process
Ease of use
About three quarters of respondents (33 out of 44) agreed that the groups they work with found the electoral system easy to use (11 strongly). Of the remaining 11 respondents, eight disagreed with the statement (one strongly) and three didn't know. Among the eight organizations that disagreed, the most commonly served group was electors with disabilities (six respondents), followed by youth (three respondents).
Figure 16. Level of agreement that groups found the electoral process easy to use
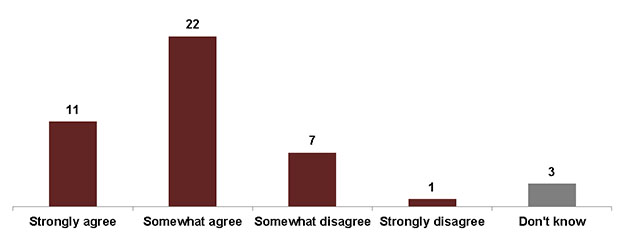
Question 30: How much do you agree or disagree with the following statement? "The group(s) we work with found the electoral process easy to use." Base: All respondents (n=44)
Text description of "Figure 16. Level of agreement that groups found the electoral process easy to use"
Question 30: How much do you agree or disagree with the following statement? "The group(s) we work with found the electoral process easy to use." Base: All respondents (n=44).
The vertical bar chart shows respondents' reported level of agreement about whether the group(s) their stakeholder organization worked with found the electoral process easy to use. The breakdown is as follows:
Total
Strongly agree: 11
Somewhat agree: 22
Somewhat disagree: 7
Strongly disagree: 1
Don't know: 3
Feeling welcome
When asked whether they agreed or disagreed that the groups they work with felt welcome when engaging with the electoral process, three quarters of respondents (33 out of 44) agreed that they felt welcome (11 strongly), six disagreed (three strongly) and five did not know. The six organizations that disagreed represented a wide variety of community groups; the most commonly served group among them was youth (three respondents).
Figure 17. Level of agreement that groups felt welcome when engaging with the electoral process
Question 31: How much do you agree or disagree with the following statement? "The group(s) we work with felt welcome when engaging with the electoral process."
Base: All respondents (n=44)
Text description of "Figure 17. Level of agreement that groups felt welcome when engaging with the electoral process"
Question 31: How much do you agree or disagree with the following statement? "The group(s) we work with felt welcome when engaging with the electoral process." Base: All respondents (n=44).
The vertical bar chart shows respondents' reported level of agreement about whether the group(s) their stakeholder organization worked with felt welcome when engaging with the electoral process. The breakdown is as follows:
Total
Strongly agree: 11
Somewhat agree: 22
Somewhat disagree: 3
Strongly disagree: 3
Don't know: 5
The six respondents who disagreed that the groups they work with felt welcome cited a number of reasons for this including the following:
- not all polling places are fully accessible;
- there are barriers to voting related to homelessness;
- some groups feel intimidated by new and complex processes;
- some groups are apathetic about politics and the importance of voting;
- the 2019 election was scheduled on a Jewish holiday (during which observant Jewish people were forbidden to vote); and
- the unique views of Indigenous people about voting and engaging in elections.
Working with Elections Canada
Just over half of the respondents said that this was their organization's first election working with EC: 23 of the 44 respondents said that it was the first time, whereas 16 said they had worked with EC in the past and five didn't know. When asked an open-ended question about how they found out about the option of partnering with EC, stakeholders cited the following examples:
- Elections Canada reached out to them;
- through their networks;
- through social media;
- through the EC website;
- through an Inspire Democracy workshop;
- through Vote PopUp; and
- through Ryerson's Democratic Engagement Exchange.
Needs and expectations
Virtually all respondents (43 out of 44) agreed that their organization's interactions with EC and Inspire Democracy met their needs and expectations (28 strongly). The remaining one respondent somewhat disagreed.
Figure 18. Level of agreement that interactions with Elections Canada and Inspire Democracy met stakeholders' needs and expectations
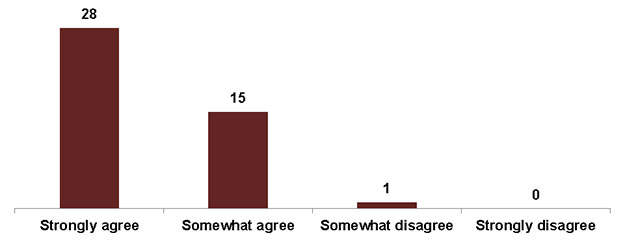
Question 35: How much do you agree or disagree with the following statement? "My organization's interactions with Elections Canada and Inspire Democracy have met our needs and expectations."
Base: All respondents (n=44)
Text description of "Figure 18. Level of agreement that interactions with Elections Canada and Inspire Democracy met stakeholders' needs and expectations"
Question 35: How much do you agree or disagree with the following statement? "My organization's interactions with Elections Canada and Inspire Democracy have met our needs and expectations." Base: All respondents (n=44).
The vertical bar chart shows respondents' reported level of agreement about whether their interactions with Elections Canada and Inspire Democracy met their organization's needs and expectations. The breakdown is as follows:
Total
Strongly agree: 28
Somewhat agree: 15
Somewhat disagree: 1
Strongly disagree: 0
Non-partisanship
Organizations that partner with EC are required to be non-partisan. The vast majority of respondents (40 out of 44) agreed that EC did a good job of explaining the non-partisanship requirement (29 strongly), whereas three disagreed (one strongly) and one person did not know.
Figure 19. Level of agreement that Elections Canada did a good job of explaining the non-partisanship requirement
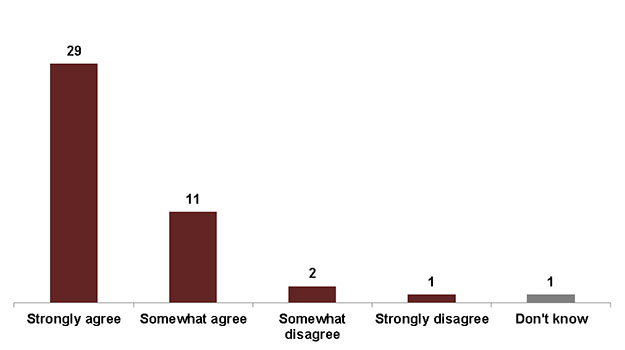
Question 36: How much do you agree or disagree with the following statement? "Elections Canada did a good job of explaining the non-partisanship requirement for its partner organizations."
Base: All respondents (n=44)
Text description of "Figure 19. Level of agreement that Elections Canada did a good job of explaining the non-partisanship requirement"
Question 36: How much do you agree or disagree with the following statement? "Elections Canada did a good job of explaining the non-partisanship requirement for its partner organizations." Base: All respondents (n=44).
The vertical bar chart shows respondents' reported level of agreement about whether Elections Canada did a good job of explaining the non-partisanship requirement for its partner organizations. The breakdown is as follows:
Total
Strongly agree: 29
Somewhat agree: 11
Somewhat disagree: 2
Strongly disagree: 1
Don't know: 1
Maintaining a relationship with Elections Canada
All 44 respondents agreed that their organizations would be interested in maintaining a relationship with EC between elections (32 strongly).
What could Inspire Democracy do differently?
The final question of the survey was open-ended and invited respondents to share about what Inspire Democracy could do differently in the future that would work better for their communities. Stakeholders' comments and suggestions included the following themes:
- improving communication channels between EC and stakeholders, as well as among stakeholders, to ensure that the resources available are widely known;
- ensuring that the roles of contractors are well defined;
- improving EC communications products so that they are clear and eye-catching, particularly when reaching out to youth and electors experiencing homelessness;
- the need to continue improving accessibility in the electoral process (e.g. by considering an accessibility coordinator role in each province to ensure that returning officers and election workers are fully versed in the accessibility tools available); and
- the need to continue collaborating with Indigenous communities (e.g. by building upon an Indigenous engagement strategy for EC that is led by Indigenous staff and engages with Indigenous communities).