 Site Menu
Detailed Findings – Report on the Survey of Campus Electors for the 43rd General Election
Awareness Levels
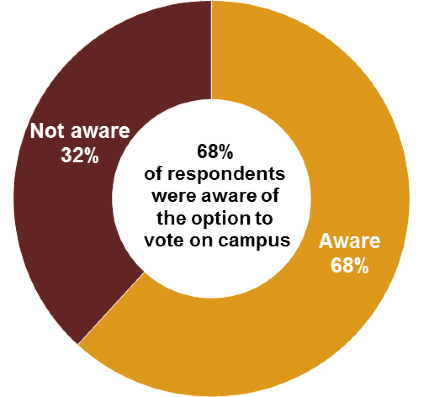
All respondents (100%) said that they were aware that a federal general election was taking place and that election day was on October 21, 2019 footnote 1 . The majority (68%) indicated that they were aware of the option to vote on campus.
Awareness of option to vote on campus footnote 2
Text version of "Chart 1: Awareness of option to vote on campus"
Q13. Were you aware that you could vote on campus between October 5 and 9, 2019? Base n=12,098; All respondents. New variables were created to combine those who voted on campus (any type of poll), non-voters, those who indicated being aware of the opportunity to vote on campus, and non-voters who indicated that they planned to vote on campus.
The doughnut chart above displays the breakdown of answers: 68 percent of respondents said that they were aware of the option to vote on campus; 32 percent said that they were not aware.
Age
Electors aged 18 to 20 were more likely to be aware of the option to vote on campus (72%) compared with an older age group, such as those aged 25 to 34 (61%).
Place of residence
Electors who resided on campus were more likely to be aware of the option to vote on campus (79%) compared with electors who lived off campus with their parents or guardians (68%) or on their own (66%).
Interest in politics
Over two-thirds (73%) of respondents who were very interested in politics were aware of the opportunity to vote on campus, compared with those who were not at all interested in politics (53%).
Voted in 2015
Respondents who had voted in the 2015 general election were more likely to have been aware of the opportunity to vote on campus (65%) when compared with electors who had not voted (56%).
Knowledge about voting on campus
Approximately one-fifth (22%) of respondents who were aware of the option to vote on campus indicated that they had been made aware by Elections Canada posters. Noticing the voting place on campus (18%); being notified by a friend, peer, teacher or family member (16%); being notified by a student association (14%); and being notified by student services (14%) were other sources of information that were frequently cited.
Sources of information about option to vote on campus footnote 3

Text version of "Chart 2: Sources of information about option to vote on campus"
Q14. How did you know that voting was offered on campus? Base n=8,610; respondents who were aware of the option to vote on campus.
The horizontal bar chart above displays the percentage of respondents' sources of information on the option to vote on campus. The breakdown is as follows:
- I saw an Elections Canada poster on campus: 22 percent
- I noticed the voting place on campus: 18 percent
- I was notified by a friend, peer, teacher, or family member: 16 percent
- I was notified by a student association: 14 percent
- I was notified by student services: 14 percent
- Non-Elections Canada social media and/or website: 6 percent
- Elections Canada website: 3 percent
- I voted this way in the last federal election: 3 percent
- Elections Canada social media: 2 percent
Age
Younger respondents, aged 18 to 20, were more likely to have learned about voting on campus by seeing an Elections Canada poster on campus (46%) compared with those aged 25 to 34 (36%).
Elections Canada social media was identified more often as the source of information for knowing about voting on campus for those aged 18 to 20 (5%) and 21 to 24 (4%) compared with those aged 25 to 34 (2%) and 35 to 54 (2%).
Non–Elections Canada social media was a method more frequently cited as a source of information by those aged 18 to 20 (12%) and 21 to 24 (12%) than those aged 35 to 54 (11%) and 25 to 34 (10%).
Younger respondents, aged 18 to 20 and 21 to 24, were more likely to have heard about voting on campus through a student association (31% and 28%, respectively) compared with those aged 25 to 34 (24%).
Being notified by student services was also a method more frequently cited by those aged 18 to 20 (30%) and 21 to 24 (27%) than those aged 25 to 34 (24%).
Place of residence
Respondents who resided on campus (36%) were more likely to have been notified about voting on campus by a friend, peer, teacher or family member compared with those who resided off campus with their parents or guardians (28%) or on their own (31%). Campus dwellers were also more likely to have been notified by a student association (42%) compared with electors who resided off campus alone (27%) or off campus with parents or guardians (22%).
Functional disability
Respondents who identified as having a disability were more likely to have been notified by a student association (32%) about the option to vote on campus compared with respondents who did not (26%).
Elections Canada social media use
Among respondents who identified Elections Canada's social media accounts as a source of information for learning about voting on campus, about half (51%) said that Facebook was the source that they used. Approximately one-quarter (26%) of these respondents identified Elections Canada's Instagram account as the source of information that they used.
Elections Canada social media platforms where voting on campus was noticed footnote 4

Text version of "Chart 3: Elections Canada social media platforms where voting on campus was noticed"
Q15. On which of the following Elections Canada social media accounts did you notice the promotion of voting on campus? Multiple response option. Base: n = 471; responses for those who noticed the promotion of voting on campus through Elections Canada's social media accounts.
The horizontal bar chart displays the percentage of social media platforms where respondents noticed the promotion of voting on campus. The breakdown is as follows:
- Facebook: 51 percent
- Instagram: 26 percent
- Twitter: 11 percent
- Snapchat: 7 percent
- YouTube: 6 percent
Age
Respondents who were 21 to 24 years old were more likely to have noticed the option to vote on campus through Elections Canada's Facebook account (83%) compared with the younger cohort of those aged 18 to 20 (72%).
Respondents aged 18 to 20 were much more likely to have noticed the option to vote on campus through Elections Canada's Instagram account (53%) compared with the older age cohort of those 21 to 24 years old (35%).
Voting Status
Voted in the 2019 general election
The majority of respondents (87%) indicated that they had voted in 2019; footnote 5 13% indicated that they had not voted. A small proportion – 8% – of those who had not voted indicated that they had not yet voted but planned to. footnote 6 Another small proportion (5%) of respondents claimed that they did not plan to vote.
Voted in 2019 footnote 7

Text version of "Chart 4: Voted in 2019"
Q6ab. Have you already voted/did you vote in the 2019 federal general election? Base n=12,067; respondents that were aware of the 2019 general election.
The pie chart above displays the percentage of respondents who indicated that they voted in the 2019 federal general election: 87 percent indicated that they voted in the 2019 general election; 13 percent indicated that they did not vote.
Age
Older individuals were most likely to say that they had voted in the 2019 general election, with 98% of those aged 55 to 74 indicating that they had voted. Conversely, respondents aged 18 to 20 were the least likely to say that they had voted (84%).
Disability
Respondents who identified as having a functional disability were less likely to say that they had voted (84%) compared with those who had not (88%). Individuals with a functional disability were more likely to indicate that they had not voted (10%) compared with those without a disability (7%).
Education
Those who claimed a higher education level were more likely to say that they had voted; 91% of those who had completed university or college indicated that they had voted compared with those with some post-secondary or college (86%) and those with high school or less (78%). Respondents who had completed high school or less were much more likely to indicate that they had not voted (13%) compared with those with some post-secondary or college (9%) and those who had completed university or college (4%).
Place of residence
Those who lived off campus with their parents or guardians were less likely to indicate that they had voted (84%) compared with those who lived on campus (89%) and those who lived off campus without parents or guardians (88%).
Indigenous status
Indigenous respondents were less likely to say that they had voted in the 2019 federal election (75%) compared with non-Indigenous respondents (88%).
Voting method used for those who were aware of Vote on Campus
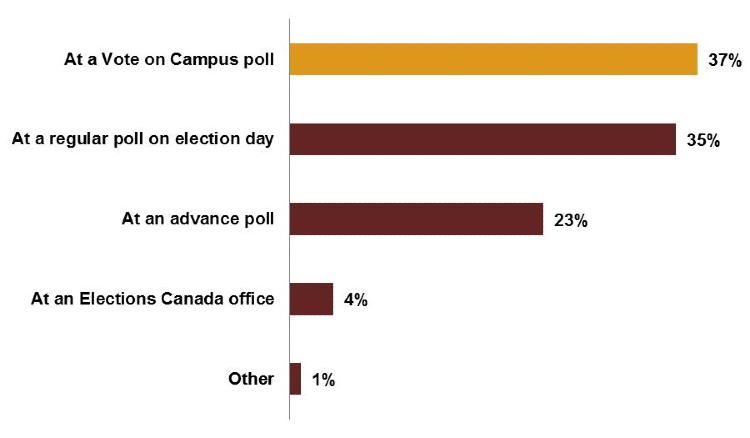
Of voters who were aware that voting on campus was an option, approximately one-third (35%) indicated that they had voted at a regular poll on election day. Nearly one-quarter (23%) said that they had voted at an advance poll footnote 8 , and 37% said that they had voted on campus as part of the Vote on Campus program footnote 9 .
Voting method used among all voters who were aware of the option to vote on campus footnote 10
Text version of "Chart 5: Voting method used among all voters who were aware of the option to vote on campus"
The above graph consists of the following questions:
- Q12. Where or how did you cast your vote? Base n=7,239; respondents who voted but not on campus.
- Vote on Campus variable (see footnote 8)
- Q13. Were you aware that you could vote on campus between October 5 and 9, 2019? Base n=12,098; All respondents. New variables were created to combine those who voted on campus (any type of poll), non-voters, those who indicated being aware of the opportunity to vote on campus, and non-voters who indicated that they planned to vote on campus.
- Total combined base for this graph: n=7264; respondents who were aware of the option to vote on campus and voted in 2019. The horizontal bar chart above displays the percentage of methods that respondents used to vote. The breakdown is as follows:
- Total
- At a Vote on Campus poll: 37 percent
- At a regular poll on election day: 35 percent
- At an advance poll: 23 percent
- At an Elections Canada office: 4 percent
- Other: 1 percent
Reasons for not voting on campus
Among those who were aware of the option to vote on campus but had not voted, footnote 11 the most frequently cited reason was that they had wanted to vote in their home riding (35%). Another commonly cited reason was that they were still deciding how to vote when voting on campus was occurring, from October 5 to 9 (30%).
One-tenth (10%) of responses made up the "Other" category, which included reasons such as long wait times, too busy, forgot, wanted to vote on election day, difficulty finding the voting place on campus, already voted and wanted to vote with a family member or friend.
Reasons for not voting on campus footnote 12

Text version of "Chart 6: Reasons for not voting on campus"
Q16. Why did you choose not to vote on campus? Base n=4,723; respondents who voted off-campus and were aware of the option to vote on campus or those who did not vote but planned to vote on campus. (Multiple responses accepted).
The horizontal bar chart above displays the reasons that respondents provided for not voting on campus. The breakdown is as follows:
- I wanted to vote in my home riding: 35 percent
- I was still deciding my vote: 30 percent
- It was easier to vote using another option: 21 percent
- I was not on campus those days: 20 percent
- The voting hours did not work with my schedule: 13 percent
- The location on campus was not convenient for me: 5 percent
- Other: 10 percent
Place of residence
Those who lived off campus without parents or guardians were more likely to say that they had not voted on campus because they were not on campus on the voting days (25%) compared with those who lived off campus with parents or guardians (15%) as well as those who lived on campus (9%).
Respondents who lived on campus were most likely to say that they had not voted on campus because they had wanted to vote in their home riding (54%) compared with those who lived off campus with parents or guardians (37%) or without parents or guardians (31%).
Those who lived off campus with their parents or guardians were more likely to say that they had not voted on campus because they were still deciding how to vote (37%) compared with those who lived off campus without their parents or guardians (26%) or on campus (23%).
Likelihood of voting without campus office
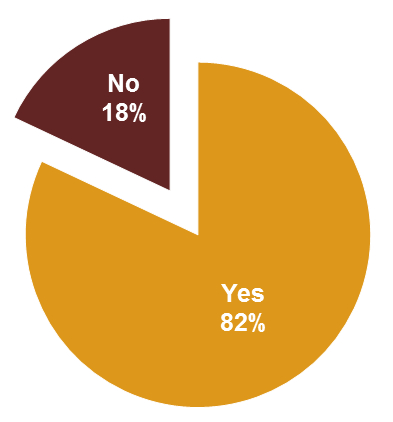
Less than one-fifth of respondents (18%) said that if voting on campus had not been available, they would not have voted at all.
Likelihood of voting without campus office footnote 13
Text version of "Chart 7: Likelihood of voting without campus office"
Q11. If voting on campus were not available, do you think you would have voted otherwise? Base n=2,851; respondents who voted on campus.
The pie chart above displays the percentage of respondents that would not have voted if voting on campus were not available: 82 percent said that they would have voted even if voting on campus was not available; 18 percent said that they would not have voted.
Age
Respondents aged 18 to 20 and 21 to 24 were more likely to say that they would not have voted at all if voting on campus had not been available (21% and 18%, respectively) when compared with respondents aged 35 to 54 (7%).
Place of residence
Respondents who lived on campus were most likely to say that they would not have voted at all if voting on campus had not been available (30%) compared with those who lived off campus without parents or guardians (18%) or off campus with parents or guardians (9%).
Preferred voting method for non-voters
Among respondents who had planned to vote but did not, nearly one-third (34%) indicated that they would have voted at a regular poll on election day, while nearly another third (29%) indicated that they would have voted on campus.
Preferred voting method for non-voters footnote 14

Text version of "Chart 8: Preferred voting method for non-voters"
Q7. Where would you have voted? Base n=389; respondents who did not vote but they planned to.
The horizontal bar chart above displays the preferred voting method for respondents that did not vote but planned to. The breakdown is as follows:
- At a regular poll on election day: 34 percent
- On campus: 29 percent
- At an advance poll: 16 percent
- At an Elections Canada office: 7 percent
- By mail: 5 percent
- Don't know: 9 percent
Functional disability
Individuals with a functional disability were more likely to say that had they voted, they would have done so on campus (40%) compared with those without a functional disability (27%).
Place of residence
Those who lived off campus with parents or guardians were most likely to say that they would have voted at a regular poll on election day (45%) compared with those who lived off campus without parents or guardians (32%) and those who lived on campus (25%).
Respondents who lived on campus were most likely to say that they would have voted on campus (55%) compared with those who lived off campus without parents or guardians (27%) or with parents or guardians (21%).
Footnotes
Back to the note1Q1ab. Were you aware that there is a federal general election taking place now/that a federal general election recently took place, with election day on October 21, 2019? Base: n = 12,098: all respondents.
Back to the note2Q13. Were you aware that you could vote on campus between October 5 and 9, 2019? Base n = 12,098: all respondents. New variables were created to combine those who had voted on campus (any type of poll), those who indicated being aware of the opportunity to vote on campus and non-voters (those who indicated that they had planned to vote on campus but had not voted).
Back to the note3Q14. How did you know that voting was offered on campus? Base n = 8,610: respondents who were aware of the option to vote on campus.
Back to the note4Q15. On which of the following Elections Canada social media accounts did you notice the promotion of voting on campus? Multiple response option. Base: n = 471: responses for those who noticed the promotion of voting on campus through Elections Canada's social media accounts.
Back to the note5Surveys tend to overestimate voter turnout figures due to a combination of the social desirability effect and sampling bias. In this survey, respondents were self-selected; therefore, there is an increased likelihood that those who completed the survey were voters; this contributes to potential sampling bias.
Back to the note6For Q1 and Q6, two variations of questions were asked, one between October 16 and 21, and the other between October 22 and 30, 2019.
Back to the note7Q6ab. Have you already voted/did you vote in the 2019 federal general election? Base n = 12,067: respondents who were aware of the 2019 general election.
Back to the note8 Those who were included in the "at an advance poll" category consisted of:
- Q12 = "at an advance poll"; or
- Those who indicated that they had voted on campus but during the advance poll days (October 11–14, 2019).
Back to the note9 A respondent was considered to have voted at a Vote on Campus office if:
- Q8a/Q8b/Q8c = "Yes" (Question: Was the respondent a campus ESP voter? Base n = 12,067: all respondents); and
- Q10 = "Between Saturday, October 5 and Wednesday, October 9, 2019" (Question: When did you cast your vote?)
Back to the note10 This graph consists of the following responses:
- Q12. Where or how did you cast your vote? Base n = 7,239: respondents who had voted but not on campus.
- Vote on Campus variable (see note 7 above).
- Q13. Were you aware that you could vote on campus between October 5 and 9, 2019? Base n = 12,098: all respondents. New variables were created to combine those who had voted on campus (any type of poll), those who indicated being aware of the opportunity to vote on campus and non-voters (those who indicated that they had planned to vote on campus but had not voted).
- Total combined base for this graph: n = 7,264: respondents who were aware of the option to vote on campus and voted in 2019.
Back to the note11This includes individuals who had voted off campus and those who had not yet voted but planned to vote on campus.
Back to the note12Q16. Why did you choose not to vote on campus? Base n = 4,723: respondents who had voted off campus and were aware of the option to vote on campus or those who had not yet voted but planned to vote on campus. Multiple responses accepted.
Back to the note13Q11. If voting on campus were not available, do you think you would have voted otherwise? Base n = 2,851: respondents who had voted on campus.
Back to the note14Q7. Where would you have voted? Base n = 389: respondents who had not voted but had planned to.