 Site Menu
Survey of Electors Following the 42nd General Election
3. Elector Awareness
Awareness of the 42nd general election was extremely high among electors, with traditional media as the dominant sources of information about the election. A sizable majority of electors also expressed some degree of interest in politics.
3.1 Awareness of Election
Awareness of the election was extremely high, with ninety-nine percent (99%) of electors surveyed indicating that they were aware of the election that took place on October 19, 2015. Awareness was also extremely high within each subgroup (Figure 3.1).
Figure 3.1: Awareness of the 42nd General Election

Text description of "Awareness of the 42nd General Election"
Base: All electors.
This level of awareness is in keeping with what has been observed in studies of previous elections. In 2008, ninety-nine percent (99%) of electors were aware of the election that took place, while in 2011 it was ninety-eight percent (98%) of electors.
- Aboriginal electors: The level of awareness of Aboriginal Canadians increased from the 2011 federal election, passing from eighty-nine percent (89%) to ninety-six percent (96%) in 2015.
Traditional media (i.e., television, radio and newspaper) were the most common sources of information on the election. Television was the most frequently cited, with seventy-seven percent (77%) of respondents identifying it as a source of information (Table 3.1).
| Q8: From what sources do you recall hearing about the election? | Total (n=2,795) |
|---|---|
| Television | 77% |
| Radio | 43% |
| Newspaper | 40% |
| Social media (including Facebook, Twitter, YouTube) | 20% |
| Word of mouth (friends, relatives, colleagues) | 20% |
| Other internet website (other than Elections Canada website) | 17% |
| From candidates and political parties | 9% |
| Voter information card (received in the mail) | 7% |
| Signs, Posters, Billboards | 7% |
| Elections Canada householder-brochure/leaflet (received in the mail) | 3% |
| Elections Canada website | 1% |
| Flyers/Pamphlets | 1% |
| Other source, please specify | 6% |
| Don't know/Refusal | 1% |
Note: Percentages may sum to more than 100%, since multiple responses were accepted.
Base: Electors aware of the 42nd general election.
In 2011, traditional media held the same position as the main source of information from which electors recall hearing about the election. However, the proportion of electors who recall hearing about the election from newspapers and television decreased from 2011 to 2015 (4% decrease for television, from 81% to 77%, and 10% decrease for newspaper, from 50% to 40%), while it remained the same for radio (43%). This may be the result of a shift in media consumption habits from traditional media to digital media. The proportions of electors who recall hearing about the election from websites other than Elections Canada increased from thirteen percent (13%) in 2011 to seventeen percent (17%) in 2015. Furthermore, social media (i.e., Facebook, Twitter and YouTube) now ranks fourth as the main source of information.
There were a number of significant variations among socio-demographic groups with regard to the sources of information that they used.
- Aboriginal Electors: Aboriginal electors were significantly less inclined to mention radio (32%, compared with 44% for non-Aboriginal electors) and newspapers (22%, compared with 44% for non-Aboriginal electors) as a source from which they heard about the election.
- Age: Traditional media (television, newspapers and radio) were less likely to be cited as sources of information on the election by young adults aged 18 to 34 (66% television; 22% newspapers; 30% radio) compared with adults aged 35 and older (82% television; 47% newspapers; 46% radio). Alternatively, older adults were less likely to cite social media (16%, compared with 35% for young adults) or word of mouth (15%, compared with 33% for young adults) as a source of information.
- Income: Radio, newspapers and other internet websites correlated positively with household income, with more electors from higher-income (>$80k) households citing them as sources of information about the election (49% radio; 44% newspapers; 23% other internet websites) compared with those from lower-income (<$40k) households (34% radio; 31% newspapers; 7% other internet websites).
- Foreign-born Electors: Newspapers were more likely to be cited by foreign-born electors (50%) than by Canadian-born electors (39%).
- Region: Electors living in Québec were also likely to mention word of mouth (11%) and social media (12%) as a source of information about the election when compared with the rest of Canada (22% and 23% respectively).
- Voting Behaviour: Respondents who did not vote in the 2015 election were less likely to recall hearing about the election from television (68%), radio (28%) and newspapers (23%) when compared with respondents who voted (78% television; 45% radio; 42% newspapers). However, respondents who did not vote were also more likely to have heard about the election from word of mouth (30%) than respondents who did vote (19%).
3.2 Interest in Politics
Overall, electors reported high levels of interest in politics. Over four-fifths of respondents (82%) indicated that they were either very (32%) or somewhat (50%) interested in politics. Twelve percent (12%) of electors said that they were not very interested in politics, and only five percent (5%) said that they were not interested at all. Interest in politics varies greatly among subgroups (Figure 3.2).
Figure 3.2: Electors Interest in Politics
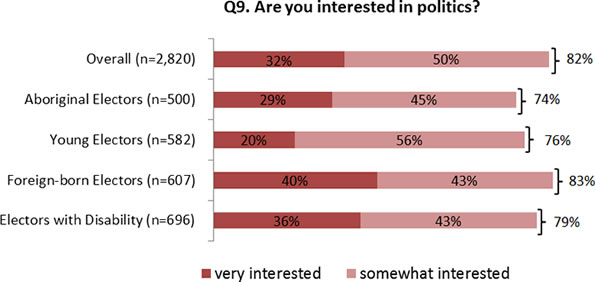
Text description of "Electors Interest in Politics"
Base: All electors.
Interest in politics remains unchanged since the 2011 general election, with eighty-one percent (81%) of electors saying that they are interested in politics (29% very interested and 52% somewhat interested). In 2008, the proportion of electors who said that they are interested in politics (76%) was lower than both subsequent elections (25% very interested and 51% somewhat interested). Since the 2008 general election, the proportion of electors with a strong interest in politics rose seven percentage points. The level of interest in politics tends to vary according to the demographic profile of electors.
- Aboriginal Electors: There was an increase in the likelihood of expressing interest in politics for Aboriginal electors. In 2015, the level of interest among the Aboriginal communities was higher (74%) than in both 2008 (62%) and 2011 (69%) elections.
- Age: Young respondents are less likely to report being interested in politics than older respondents (76%, compared with 84%). Indeed, a smaller proportion of young adults (aged 18 to 34) reported being very interested in politics (20%) than adults aged 35 or older (36%).
- Gender: Overall, male electors were more interested in politics than female electors (86% to 80%). Indeed, men were more likely than women to report being very interested in politics (37% to 28%). However, there was little to no difference between the proportion of men and women who reported being somewhat interested or not very interested in politics.
- Income: The large majority of respondents in all income brackets indicated that they were very or somewhat interested in politics. Nonetheless, a significantly higher proportion of respondents from higher-income (>$80k) households said that they were very interested in politics (38%) compared with respondents from middle-income ($40k–$80k) or lower-income (<$40k) households (29% and 26%, respectively).
- Voting Behaviour: The percentage of respondents who reported that they were not at all interested in politics was significantly higher among voters who did not vote (20%) than those who did vote (3%).