 Site Menu
Survey of Election Officers Following the 42nd Federal General Election
7. Polling Sites Accessibility
This section presents findings on election officers' evaluation of the suitability of the building they worked in for holding an election.
Building Suitability for Holding an Election
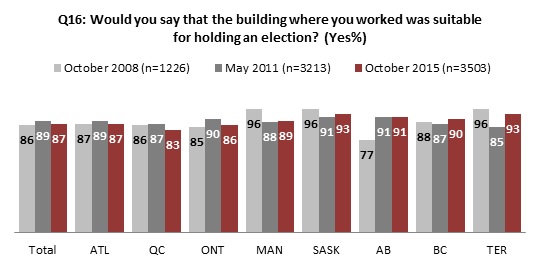
Most officers reported that the building where they worked was suitable for holding an election (87%). While this proportion is similar to that from previous reporting periods, it represents a slight decrease from 2011 results (89%).
For the 2015 election, there were significant differences based on province or territory in the percentage of officers reporting that the building where they worked was suitable for holding an election. Fewer officers in Quebec and Ontario reported that the building where they worked was suitable for holding an election (TOP2: 83% and 86%, respectively) compared with other regions.
A scan of regional trends over the three reporting periods reveals:
- stable satisfaction levels in the Atlantic Provinces, Saskatchewan, Ontario, and British Columbia
- decreasing satisfaction levels in Quebec and Manitoba
- increasing satisfaction levels in Alberta and the Territories
Chart 11 : Building suitability for holding an election, by regionFootnote 13
Text Description of "Chart 11 : Building suitability for holding an election, by region"
Base: those who found the building where they worked suitable for holding an election
Of the 463 election officers who reported that their buildings were unsuitable for holding an election, the top reasons were as follows (in descending order): there was not enough room (36%, down 3% from 2011), it was too cold (29%, up 20% from 2011), it was not accessible for people with disabilities (18%, up 3% from 2011), it was an unsuitable facility (13%, up 8% from 2011), and it had no parking space (12%, up 6% from 2011). "Hard to find building / poor signage directing people to location" (6%, down 3% from 2011) was still a commonly reported reason for building unsuitability in 2015, while "nothing was set up/not enough time to set up" was a less common reason compared with the 2011 election (1%, down 7% from 2011).
| Q17: Why do you say that? | Overall (n=463) |
|---|---|
| % | |
| Not enough room | 36 |
| Too cold or poor heating | 29 |
| Not accessible for people with disabilities | 18 |
| No parking space | 12 |
| Facility unsuitable (gym / seniors' home / basement / church, etc.) | 10 |
| Awkward or difficult to navigate inside the building | 6 |
| Poor lighting | 6 |
| Hard to find building / poor signage directing people to location | 6 |
| Lack of washrooms/lunchroom/kitchen | 6 |
| Nearby activities/noise/distraction | 5 |
| No telephones | 2 |
| Lack of privacy / non-voter pedestrian traffic | 1 |
| Nothing was set up/not enough time to set up | 1 |
| Other | 11 |
| DK/Refused | 1 |
In regard to differences between regions, significantly fewer officers from British Columbia reported that "not enough space" was a reason for the building being unsuitable to hold an election (17%) compared with officers from Quebec (41%), Ontario (37%), and Alberta (41%), for whom it was a most commonly cited reason. For British Columbia, the most commonly cited reason for building unsuitability was "no parking space" (34%), which was significantly more than the other regions, for which lacking parking spaces were cited by from 1% (Saskatchewan) to 15% (Manitoba) of officers. Further, for British Columbia (28%), the Atlantic Provinces (29%), and Manitoba (20%), "lack of accessibility for people with disabilities" was a more commonly cited reason for building unsuitability, which was significantly more officers than those who cited this as a reason in Quebec (7%).
Provision of Services to Electors with Disabilities
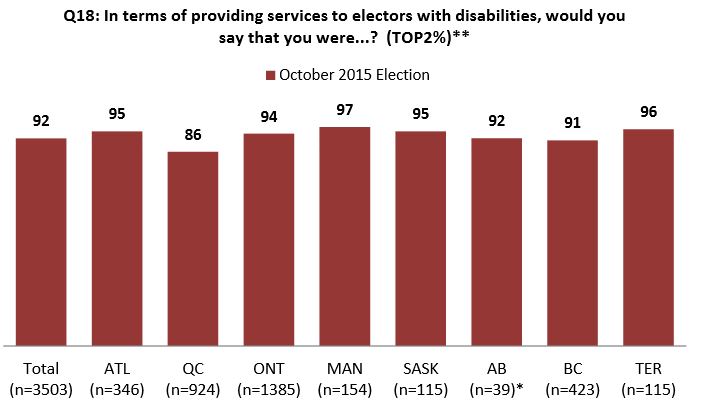
Most election officers (TOP2: 92%) felt that they were prepared in terms of providing services to electors with disabilities, though respondents in Quebec (BTM2: 9%) were significantly less likely to share this opinion than respondents from other regions.
Chart 12 : Level of preparedness when providing services to electors with disabilities, by region
Text Description of "Chart 12 : Level of preparedness when providing services to electors with disabilities, by region"
* Caution should be used when interpreting results due to small sample.
** TOP2 (Very well prepared + fairly well prepared)
NOTE: Not all options listed. Some DROs (n=32) reported that they did not have to provide services to electors with disabilities.
Election officers who worked at Aboriginal reserve polling stations were significantly more likely to report being "very well prepared" in terms of providing services to electors with disabilities (72%) compared with officers who worked at seniors' homes (65%) and student residences (64%) polling stations. Comparatively, officers who worked at polling stations at seniors' homes reported that they were "not very well prepared" to provide services to electors with disabilities (5%) compared with officers who worked at Aboriginal reserve polling stations (3%).
| Q18: In terms of providing services to electors with disabilities, would you say that you were...? | Polling Station | ||||
|---|---|---|---|---|---|
| Abo. Reserve (n=282) | Sen. / LT Care (n=797) | Stud. Res. (n=466) | Other (n=1958) | Overall (n=3503) | |
| % | |||||
| TOP2 | 94 | 93 | 91 | 92 | 92 |
| BTM2 | 5 | 6 | 6 | 6 | 6 |
| Very well prepared | 72+ | 65 | 64 | 68 | 67 |
| Somewhat well prepared | 21 | 29+ | 28+ | 24 | 25 |
| Not very well prepared | 3- | 5 | 5 | 5 | 5 |
| Not at all prepared | 2 | 1 | 2 | 1 | 1 |
| DK/Refused | 1 | 1 | 2 | 2 | 2 |
NOTE: Not all options listed. Some DROs (n=32) reported that they did not have to provide services to electors with disabilities.
Election officers who worked at both advance and ordinary polls (79%) were significantly more likely to report being "very well prepared" to provide services to electors with disabilities than those who worked at ordinary (66%) and mobile polls (63%). Additionally, officers who worked at the advance (25%), ordinary (25%), or mobile polls (30%) were significantly more likely to report being "somewhat well prepared" than those who worked both advance and ordinary polls (15%).
| Q18: In terms of providing services to electors with disabilities, would you say that you were...? | Type of Poll | ||||
|---|---|---|---|---|---|
| Advance (n=232) | Ordinary (n=2997) | Adv. + ord. (n=224) | Mobile (n=49)* | Overall (n=3503) | |
| % | |||||
| TOP2 | 94 | 92 | 94 | 93 | 92 |
| BTM2 | 5 | 6 | 4 | 7 | 6 |
| Very well prepared | 70 | 66 | 79+ | 63 | 67 |
| Somewhat well prepared | 25 | 25 | 15- | 30+ | 25 |
| Not very well prepared | 5 | 5 | 4 | 6 | 5 |
| Not at all prepared | 0 | 1 | 0 | 1 | 1 |
| DK/Refused | 1 | 2 | 1 | 0 | 2 |
* Caution should be used when interpreting results due to small sample.
NOTE: Not all options listed. Some DROs (n=32) reported that they did not have to provide services to electors with disabilities.
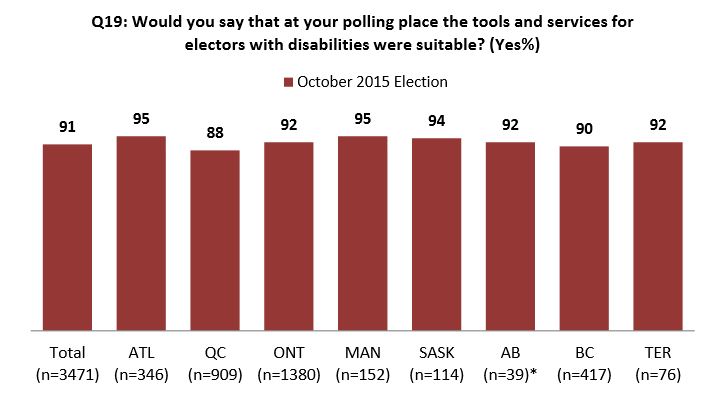
Most election officers (91%) agreed that the tools and services for electors with disabilities were suitable at their polling place. Respondents in Quebec (88%) were the least likely to feel this way, which was a significantly lower number of respondents than in the Atlantic Provinces (95%), Ontario (92%), Manitoba (95%), and Saskatchewan (94%).
Chart 13 : Suitability of tools and services for electors with disabilities, by region
Text Description of "Chart 13 : Suitability of tools and services for electors with disabilities, by region"
* Caution should be used when interpreting results due to small sample.
NOTE: Not all options listed. Some DROs (n=29) reported that they did not have to provide services to electors with disabilities.
Election officers who worked in Aboriginal reserve polls were significantly more likely to report that the tools and services for electors with disabilities were suitable (95%) than those who worked at a polling station at a seniors' home (91%) and student residence (88%).
| Q19: Would you say that at your polling place the tools and services for electors with disabilities were suitable? | Polling Station | ||||
|---|---|---|---|---|---|
| Abo. Reserve (n=280) | Sen. / LT Care (n=796) | Stud. Res. (n=460) | Other (n=1937) | Overall (n=3473) | |
| % | |||||
| Yes | 95+ | 91 | 88 | 91 | 91 |
| No | 4 | 9+ | 10+ | 6 | 7 |
| DK/Refused | 1 | 1 | 1 | 2 | 2 |
NOTE: Not all options listed. Some DROs (n=29) reported that they did not have to provide services to electors with disabilities.
Election officers who worked in advance polls (94%) were significantly more likely than those who worked in mobile polls (86%) to report that the tools and services for electors with disabilities were suitable.
For staffing positions, there are no significant differences to report.
| Q19: Would you say that at your polling place the tools and services for electors with disabilities were suitable? | Type of Poll | Staffing Position | ||||||||
|---|---|---|---|---|---|---|---|---|---|---|
|
Adv.
(n=232) |
Ord. (n=2967) | Adv. + ord. (n=222) | Mobile (n=49)* |
DRO
(n=1229) |
IO
(n=421) |
CPS (n=245) | RegO (n=315) | PC (n=1261) | Overall (n=3471) | |
| % | ||||||||||
| Yes | 94+ | 91 | 91 | 86- | 90 | 91 | 92 | 92 | 92 | 91 |
| No | 4- | 7 | 7 | 9+ | 6 | 9 | 8 | 5 | 6 | 7 |
| DK/Refused | 2 | 2 | 1 | 4 | 1 | 0 | 1 | 3 | 2 | 2 |
* Caution should be used when interpreting results due to small sample.
NOTE: Not all options listed. Some DROs (n=29) reported that they did not have to provide services to electors with disabilities.
Return to source of Footnote 13 N values: ATL (n=346); QC (n=924); ONT (n=1385); MAN (n=154); SASK (n=115); AB (n=39); BC (n=423); TER (n=115)