 Site Menu
Survey of Election Officers Following the 42nd Federal General Election
3. Satisfaction with Remuneration
The following section presents information on the satisfaction of election officers with their hourly rate of pay and the time it took to receive their paycheque.
Hourly Rate of Pay
Overall, 8 in 10 respondents (81%) were satisfied with their rate of pay in 2015. This proportion represents a slight increase from 2011 (78%), and is the same as the 2008 result. More precisely, the overall satisfaction was higher than in 2011 across the country, with the exception of Alberta, where it was slightly lower (69%, compared with 72%). Although officers in the Territories and in Alberta were significantly less likely to report satisfaction with their hourly rate of pay, it is worth noting that the overall satisfaction in the Territories increased at a rate of about ten percentage points (10%) per election analysis period since 2008. Officers in Atlantic Provinces were significantly more likely to be satisfied with their hourly pay (91%), a seven point increase from 2011.
Chart 2: Hourly rate of pay satisfactionFootnote 4
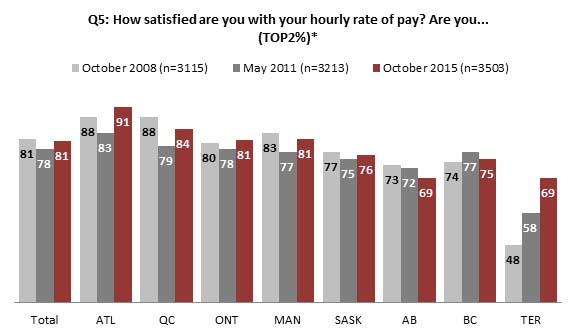
Text Description of "Chart 2 : Hourly rate of pay satisfaction"
* TOP2 (Very satisfied + fairly satisfied)
Respondents who worked in ordinary and mobile polls were significantly more likely to be satisfied with their hourly rate of pay (TOP2: 82% each) than other poll type groups. Further, respondents who worked in both advance and ordinary polls were significantly more likely to report that they were "not very satisfied" compared with those who worked in mobile polls (21%, compared with 12%). It is worth noting that those who worked in advance polls were more likely to be "very satisfied" (38%) and less likely to be "fairly satisfied" (38%).
Central poll supervisors reported the highest levels of satisfaction with their hourly rate of pay (TOP2: 86, compared with 81% overall). Further, central poll supervisors (TOP2: 86%) and registration officers (TOP2: 85%) were significantly more likely to report being satisfied than information officers (TOP2: 78%) and poll clerks (TOP2: 78%). Worth nothing is that information officers (BTM2: 21%) and poll clerks (BTM2: 20%) were significantly more likely to be unsatisfied compared with central poll supervisors (BTM2: 13%).
| Q5: How satisfied are you with your hourly rate of pay? Are you... | Type of Poll | Staffing Position | ||||||||
|---|---|---|---|---|---|---|---|---|---|---|
|
Adv.
(n=232) |
Ord. (n=2997) | Adv. + ord. (n=224) | Mobile (n=49)* |
DRO
(n=1261) |
IO
(n=421) |
CPS (n=245) | RegO (n=315) | PC (n=1261) | Overall (n=3503) | |
| % | ||||||||||
| TOP2 | 76 | 82 | 77 | 82 | 83 | 78 | 86 | 85 | 78 | 81 |
| BTM2 | 23 | 17 | 23 | 17 | 16 | 21 | 13 | 15 | 20 | 18 |
| Very satisfied | 38 | 33 | 30 | 34 | 33 | 35 | 38+ | 38+ | 30 | 33 |
| Fairly satisfied | 38- | 49 | 47 | 48 | 51+ | 43 | 48 | 47 | 48 | 48 |
| Not very satisfied | 17 | 13 | 21+ | 12 | 13 | 16 | 12 | 10 | 15 | 14 |
| Not at all satisfied | 6 | 5 | 2 | 4 | 4 | 5 | 2 | 5 | 6 | 4 |
| DK/Refused | 1 | 1 | 0 | 1 | 1 | 1 | 1 | 0 | 1 | 1 |
* Caution should be used when interpreting results due to small sample.
Reception of Paycheque
The overall satisfaction with the time it took to receive the paycheque (86%) has decreased by ten percentage points since previous report periods, compared with 2011 and 2008 (96% each). Despite this decrease, it is still at a relatively high level, with more than 8 in 10 respondents (86%) reporting being "very satisfied" (47%) or "fairly satisfied" (39%). Officers in Manitoba (76%) and in the Territories (73%) were significantly less likely to report being satisfied than other regions.
Chart 3: Reception of paycheque satisfactionFootnote 5

Text Description of "Chart 3 : Reception of paycheque satisfaction"
* TOP2 (Very satisfied + fairly satisfied)
Election officers who worked at ordinary polls were significantly more likely than all other types of polls to be satisfied with the time it took to receive their paycheque (TOP2: 87%). Further, the respondents who worked at advance polls (51%), ordinary polls (48%), or mobile polls (50%) were significantly more likely to report being "very satisfied" than those who worked at both advance and ordinary polls (36%).
Central poll supervisors (55%) and deputy returning officers (50%) were significantly more likely than registration officers (41%) and poll clerks (45%) to be "very satisfied" with the time it took to receive their paycheque. However, deputy returning officers (TOP2: 89%) were significantly more likely than information officers (TOP2: 81%) and registration officers (TOP2: 82%) to be satisfied overall. Further, information officers (7%) and registration officers (6%) were significantly more likely than central poll supervisors (2%) to be "not at all satisfied."
| Q6: How satisfied are you with the time it took to receive your paycheque? Are you... | Type of Poll | Staffing Position | ||||||||
|---|---|---|---|---|---|---|---|---|---|---|
|
Adv.
(n=232) |
Ord. (n=2997) | Adv. + ord. (n=224) | Mobile (n=49)* |
DRO
(n=1261) |
IO
(n=421) |
CPS (n=245) | RegO (n=315) | PC (n=1261) | Overall (n=3503) | |
| % | ||||||||||
| TOP2 | 85 | 87 | 79 | 83 | 89 | 81 | 87 | 82 | 86 | 86 |
| BTM2 | 15 | 13 | 20 | 17 | 11 | 17 | 13 | 17 | 14 | 13 |
| Very satisfied | 51+ | 48+ | 36 | 50+ | 50+ | 49 | 55+ | 41- | 45 | 47 |
| Fairly satisfied | 35 | 39 | 43 | 33 | 39 | 33- | 32- | 41 | 41 | 39 |
| Not very satisfied | 10 | 9 | 15 | 14 | 8 | 10 | 11 | 11 | 11 | 10 |
| Not at all satisfied | 5 | 4 | 5 | 2 | 3 | 7+ | 2 | 6+ | 3 | 4 |
| DK/Refused | 0 | 1 | 1 | 0 | 1 | 1 | 1 | 1 | 1 | 1 |
* Caution should be used when interpreting results due to small sample.
Return to source of Footnote 4 n values: ATL (n=346); QC (n=924); ONT (n=1385); MAN (n=154); SASK (n=115); AB (n=39); BC (n=423); TER (n=115)
Return to source of Footnote 5 N values: ATL (n=346); QC (n=924); ONT (n=1385); MAN (n=154); SASK (n=115); AB (n=39); BC (n=423); TER (n=115)