 Site Menu
Survey of Election Officers following the 41st Federal General Election
Section 5: Polling Sites Accessibility
The following section reports on the evaluation of election officers regarding the suitability of the building they worked in for holding an election, whether it had level-access for wheelchairs and enough directional signage to help electors find their way to the polling station.
Building Suitability for Holding an Election
Most officers (89%) agreed that the building they worked in was suitable for holding an election, providing a slight increase over 2008 (86%). Looking at the 2011 results by region, officers in Ontario (90%) were more likely to find their building suitable for an election than officers in Quebec (87%). Information officers were less likely (85%) to find their building suitable for an election.
Q8: "Would you say that the building where you worked was suitable for holding an election?" By region (2011: n=3,213; 2008: n=1,226)
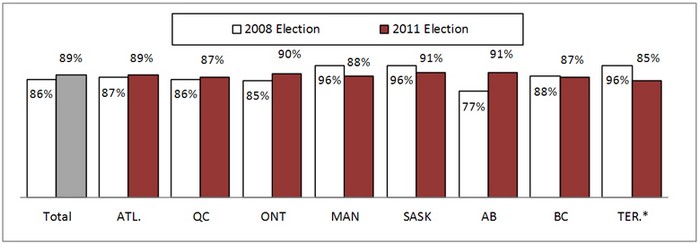
Percentage of those who found the building suitable for holding an election.
*Caution should be used when interpreting results due to small sample.
Those who felt the building was not suitable for holding an election (n=370) reported that there was not enough room (39%), it was not handicapped accessible (15%), had poor temperature control (9%), had poor indications/directions (9%), among a variety of reasons.
| Total | |
|---|---|
| Not enough room/too crowded | 39% |
| Not handicapped accessible | 15% |
| Poor indications/directions weren't indicated | 9% |
| Poor heating/too cold | 9% |
Top Reasons
The top reasons (not enough room/too crowded) were similar across all regions, staffing positions and type of poll; however, as shown in the table below, some variance between regions can be observed.
| Total | ATL. | QC | ON | MAN | SASK | AB | BC | TER.* | |
|---|---|---|---|---|---|---|---|---|---|
| Not enough room / too crowded | 39% | 36% | 42% | 34% | 70% | 52% | 30% | 42% | 0% |
| Not handicapped accessible | 15% | 18% | 14% | 22%+ | 13% | 4% | 1%- | 13% | 0% |
| Poor heating / too cold | 9% | 12% | 12% | 3%- | 2% | 12% | 16% | 11% | 0% |
| Poor indications / directions | 9% | 4% | 9% | 6% | 0% | 0% | 15% | 17%+ | 0% |
| Poor setup | 8% | 9% | 14%+ | 4% | 0% | 0% | 1% | 7% | 0% |
| Located in a school / children around / security | 8% | 0% | 7% | 6% | 13% | 0% | 15% | 14% | 0% |
| Poor access (general) | 6% | 5% | 5% | 6% | 0% | 37% | 2% | 5% | 0% |
| No parking spaces | 6% | 4% | 1%- | 7% | 13% | 2% | 4% | 17%+ | 0% |
| Venue unsuitable (general) | 5% | 0% | 5% | 8% | 0% | 3% | 13%+ | 0% | 71% |
| Too many polling stations | 4% | 1% | 2% | 7% | 0% | 12% | 1% | 4% | 0% |
| No / poor access to bathrooms | 4% | 4% | 8%+ | 2% | 0% | 0% | 7% | 0% | 0% |
| Poor location / people had to walk too far | 3% | 0% | 0% | 5% | 0% | 12% | 7% | 4% | 0% |
| Dirty | 3% | 9%+ | 6%+ | 0%- | 0% | 2% | 0% | 1% | 0% |
| Not enough privacy | 2% | 0% | 0% | 3% | 3% | 3% | 1% | 5% | 0% |
| Poor ventilation | 2% | 0% | 6%+ | 1% | 3% | 0% | 1% | 0% | 0% |
| Too many stairs | 2% | 0% | 1% | 2% | 0% | 0% | 8%+ | 6% | 0% |
| Located in a worshiping place | 2% | 1% | 3% | 0% | 0% | 0% | 1% | 7%+ | 0% |
| Badly organized / No communication | 2% | 11%+ | 2% | 2% | 3% | 3% | 0% | 0% | 0% |
| Poor lighting | 1% | 1% | 0% | 3%+ | 0% | 2% | 1% | 1% | 0% |
| Located in a nursing home / senior centre | 1% | 8%+ | 0% | 0% | 0% | 3% | 0% | 1% | 0% |
| Located in a rink / arena | 1% | 4%+ | 0% | 2% | 0% | 0% | 1% | 0% | 0% |
| Location was under construction / renovation | 1% | 0% | 1% | 1% | 3% | 20% | 0% | 0% | 0% |
| Shared location / voting interrupted / disturbed | 1% | 0% | 1% | 0% | 2% | 0% | 2% | 2% | 0% |
| Located in an open hallway | 1% | 0% | 0% | 3%+ | 0% | 0% | 0% | 0% | 0% |
| Located in a basement | 1% | 0% | 1% | 2% | 0% | 0% | 0% | 0% | 0% |
| Venue was in disrepair | 1% | 0% | 1% | 0% | 3% | 0% | 0% | 6%+ | 0% |
| (DO NOT READ) DK / Refusal | 2% | 1% | 3% | 2% | 3% | 0% | 0% | 1% | 0% |
*Caution should be used when interpreting results due to small sample.
Level Access for Wheelchairs
Ninety-three percent (93%) of officers could remember that the building they worked in had level-access for wheelchairs. This proportion was significantly higher in the Atlantic (95%) and British Columbia (96%), and lower in Quebec (88%).
| Total | ATL. | QC | ON | MAN | SASK | AB | BC | TER.* | N. of 50th | STUDENT RES.* | |
|---|---|---|---|---|---|---|---|---|---|---|---|
| Yes | 93% | 95%+ | 88%- | 93% | 93% | 94% | 94% | 96%+ | 100% | 96% | 83% |
| No | 5% | 4% | 9%+ | 4%- | 4% | 5% | 4% | 3% | 0% | 4% | 9% |
| I don't know | 2% | 1% | 3% | 3% | 3% | 1% | 2% | 0%- | 0% | 0%- | 8% |
*Caution should be used when interpreting results due to small sample.
Central poll supervisors were more likely to remember that their building had a level-access (95% vs. 93% overall).
| Total | Advance | Ordinary | Mobile | CPS | DRO | IO | |
|---|---|---|---|---|---|---|---|
| Yes | 93% | 94% | 92%- | 97%+ | 95%+ | 92% | 93% |
| No | 5% | 6% | 5% | 3% | 5% | 5% | 6% |
| I don't know | 2% | 0%- | 2%+ | 0%- | 1%- | 3%+ | 1%- |
Central poll supervisors who recalled having level-access were asked if they had enough signs indicating that the station has such access. Overall, 87% reported they had received enough signs. Officers in Manitoba (99%) were those who recalled the most having received enough signs, while officers from British Columbia (78%) were those who were the least likely to report having received enough signs.
| Total | ATL. | QC | ON | MAN | SASK | AB | BC | TER. | N. of 50th | |
|---|---|---|---|---|---|---|---|---|---|---|
| Yes | 87% | 93% | 88% | 85% | 99%+ | 98% | 88% | 78%- | 100% | 84% |
| No | 10% | 7% | 8% | 11% | 1%- | 2% | 9% | 16%+ | 0% | 11% |
| I don't know | 3% | 0% | 3% | 4% | 0% | 0% | 4% | 5% | 0% | 4% |
Only central poll supervisors who remembered a level access.
A wide majority of officers (90%) also found that they had received enough directional signs designed to help electors find their way to the room where the vote took place. Officers from Manitoba were more likely (99%) to find that they had received enough directional signage, while those from Saskatchewan were more likely to say they did not know (6% vs. 1% of others).
| Total | ATL. | QC | ON | MAN | SASK | AB | BC | TER.* | N. of 50th | STUDENT RES.* | |
|---|---|---|---|---|---|---|---|---|---|---|---|
| Yes | 90% | 96% | 88% | 86% | 99%+ | 94% | 93% | 86% | 100% | 96% | 100% |
| No | 9% | 4% | 12% | 12% | 1%- | 0% | 7% | 11% | 0% | 2%- | 0% |
| I don't know | 1% | 0% | 0% | 1% | 0% | 6%+ | 0% | 3% | 0% | 2% | 0% |
*Caution should be used when interpreting results due to small sample.
Complaints Regarding Accessibility
Most officers (89%) did not witness any complaints regarding accessibility of the polling stations. That said, those in British Columbia (20%) were most likely to report complaints and those in Alberta (7%) were less likely to do so.
| Total | ATL. | QC | ON | MAN | SASK | AB | BC | TER.* | N. of 50th | STUDENT RES.* | |
|---|---|---|---|---|---|---|---|---|---|---|---|
| Yes | 11% | 8% | 13% | 10% | 7% | 7% | 7%- | 20%+ | 8% | 10% | 28% |
| No | 89% | 92%+ | 87% | 90% | 93% | 93% | 93%+ | 80%- | 92% | 90% | 72% |
*Caution should be used when interpreting results due to small sample.
Complaints were more likely to be witnessed by information officers (18%) and central poll supervisors (15%) compared to deputy returning officers (9%). Complaints were also more likely to have been seen at advanced polls (14%).
| Total | Advance | Ordinary | Mobile | CPS | DRO | IO | |
|---|---|---|---|---|---|---|---|
| Yes | 11% | 14%+ | 11% | 6%- | 15%+ | 9%- | 18%+ |
| No | 89% | 86%- | 89% | 94%+ | 85%- | 91%+ | 82%- |
When looking at the subject of the complaints, the most common issues were about physical accessibility (16%) and directional signage (13%). Waiting lines and lack of information regarding the exact location of the polling station accounted respectively for 8% and 7% of the complaints witnessed.
| Total | |
|---|---|
| Accessibility/reduced mobility accessibility (seniors, etc.) was an issue | 16% |
| Poor signage/No indications/People couldn't find their way | 13% |
| Lines were too long/Wait was too long | 8% |
| People were not informed well enough as to where their polling station was (showed up at wrong polling station) | 7% |
Top Answers.
Officers from Quebec (19%) were more likely to report complaints for long waits. In Alberta, officers were more likely to mention that electors lacked information about the location of their polling station (16% vs. 7% overall), that there was too much walking (8% vs. 1% overall) and that there were too many stairs (10% vs. 1% overall). Those in British Columbia were more likely to indicate complaints about the signage (20% vs. 13% overall) and that the venue was in disrepair (4% vs. 1% overall).