 Site Menu
Survey of Election Officers following the 41st Federal General Election
Section 3: Satisfaction with Remuneration
The following section report on the satisfaction of election officers regarding their hourly rate of pay and the time it took to receive their pay check.
Hourly Rate of Pay
The overall level of satisfaction with hourly rate of pay was at 78% in 2011. This represents a slight but statistically significant decrease compared to 2008 (81%). Levels of satisfaction decreased everywhere except in the Territories. Looking at the 2011 results by region, respondents from Atlantic Provinces (83%) were significantly more satisfied while those from Alberta were less satisfied with their hourly rate of pay (72%).
Q6: "How satisfied are you with your hourly rate of pay?" By region (2011: n=3,213; 2008: n=3,115)
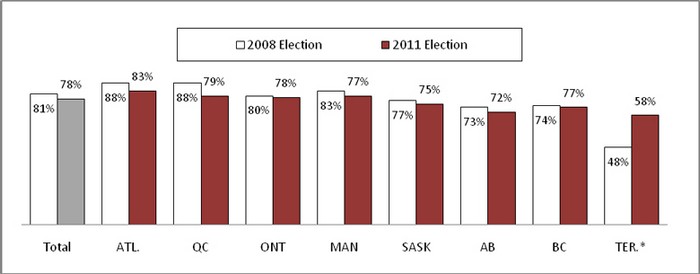
Text description of graph Q6: "How satisfied are you with your hourly rate of pay?" By region
*Caution should be used when interpreting results due to small sample.
Those who worked in advance polls (70%) indicated lower levels of satisfaction than those that worked in ordinary or mobile polls, while those working in mobile polls had the highest rate of satisfaction regarding the hourly rate of pay (87% vs. 78% overall).
Central poll supervisors reported the highest levels of satisfaction regarding the hourly rate of pay, with 84% being fairly or very satisfied (significantly higher when compared to 78% overall). Information officers reported significantly lower levels of satisfaction with only 42% being fairly satisfied and 28% being very satisfied, for a combined total of 70%.
| Total | Advance | Ordinary | Mobile | CPS | DRO | IO | |
|---|---|---|---|---|---|---|---|
| Very satisfied | 31% | 29% | 31% | 36% | 34% | 31% | 28% |
| Fairly satisfied | 47% | 42%- | 47%+ | 51% | 50% | 48% | 42%- |
| Not very satisfied | 16% | 20%+ | 15%- | 12% | 13% | 15% | 18% |
| Not at all satisfied | 6% | 9%+ | 5%- | 1%- | 2%- | 5%- | 10%+ |
Reception of Pay Check
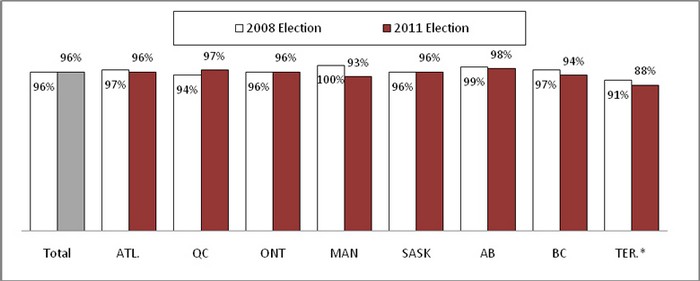
Most officers were satisfied with the time it took to receive their pay check. That being said, 2011 saw a significant decrease in satisfaction when compared to 2008 in Manitoba (from 100% to 93%) and British Columbia (from 97% to 94%). In contrast, there was an increase in satisfaction in Quebec (from 94% in 2008, to 97% in 2011). Comparing the 2011 results across the different regions, officers in Quebec were significantly more likely to report being satisfied (97%) while those from British Columbia were more likely to report not being satisfied with the time it took to receive their pay check (6% not satisfied).
Q7: "How satisfied are you with the time it took to receive your pay check?" By region (2011: n=3,213; 2008: n=3,115)
Percentage rating very/fairly satisfied (combined ratings of 1 and 2 on a 4 point scale).
* Caution should be used when interpreting results due to small sample.
Satisfaction also varied by staffing position: deputy returning officers were more likely than other groups to be very satisfied (79%) while information officers were significantly less likely to report being very satisfied (72%) and more likely to be fairly satisfied (23%) with the time it took to receive their pay check.
| Total | Advance | Ordinary | Mobile | CPS | DRO | IO | |
|---|---|---|---|---|---|---|---|
| Very satisfied | 78% | 79% | 78% | 81% | 80% | 79%+ | 72%- |
| Fairly satisfied | 18% | 15%- | 18%+ | 16% | 16% | 17% | 23%+ |
| Not very satisfied | 2% | 3%+ | 2%- | 2% | 2% | 2% | 2% |
| Not at all satisfied | 2% | 3%+ | 1% | 0% | 1% | 1%- | 3%+ |