 Site Menu
Survey of Election Officers following the 41st Federal General Election
Section 10: Vote Counting
The following section reports on how the vote counting went, which includes the usefulness of the flow chart provided by Elections Canada and how the lists of electors were disposed.
The Vote Counting Process
Overall 94% of officers rated the vote counting as going fairly or very well, which is statistically the same as the 95% in 2008. For the most part, there were similar results by province when compared to 2008. However, Manitoba saw a significant decline in the proportion of election officers rating the vote counting as very or fairly well (from 98% in 2008, to 92% in 2011).
Q40: "Overall, would you say the vote counting went very well, fairly well, not very well or not well at all?" By region (2011: n=2,654; 2008: n=2,489)
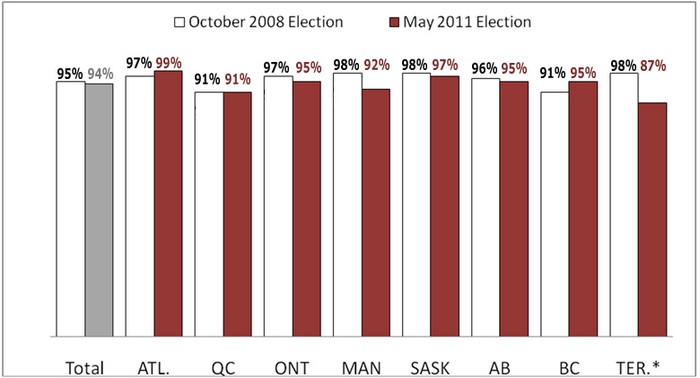
Percentage saying that the vote counting went fairly/very well (combined ratings of 1 and 2 on a 4 point scale).
Central poll supervisors and deputy returning officers only.
*Caution should be used when interpreting results due to small sample.
In 2011, officers in the Atlantic Provinces were significantly more likely (99%) to report that the vote counting went fairly or very well, while officers in Quebec were significantly less likely (91%) to say so. Central poll supervisors were less likely to say that the vote counting went very well, and more likely to say that it went either fairly well or not very well. Lastly, officers who worked at advance polls were slightly less likely to say the vote counting went fairly well, when compared to officers who worked at ordinary polls.
| Total | Advance | Ordinary | Mobile | CPS | DRO | |
|---|---|---|---|---|---|---|
| Very well | 73% | 77% | 73% | 74% | 60%- | 76%+ |
| Fairly well | 21% | 14%- | 21%+ | 21% | 31%+ | 19%- |
| Not very well | 5% | 7% | 4% | 4% | 7%+ | 4%- |
| Not well at all | 1% | 0% | 1% | 0% | 0% | 1% |
Central poll supervisors and deputy returning officers only.
A variety of reasons were provided for why the vote counting did not go well. The main reasons provided were that the officers' partners were not considered competent (32%), that the instructions were not clear (24%) or that the vote tally did not balance (20%).
There was some variance by region and staffing position. For instance, officers from Ontario were more likely (30%) to report that the vote counting did not balance. In Quebec, officers were more likely (36%) to report that the instructions were not clear or that the training was not good enough, or that the venue was too small (14%).
Central poll supervisors were more likely to report that they had to do the work of other people (20%), whereas deputy returning officers were more likely to mention the vote counts not balancing out.
| Total | |
|---|---|
| My partners were not competent | 32% |
| Instructions were not clear / training not good enough | 24% |
| Did not balance | 20% |
| Too long / It took too much time | 17% |
| It was too complicated/too many steps | 11% |
| I had to work there until late at night | 10% |
| Not enough people to help | 7% |
| Venue was too small | 6% |
| I had to do the work of other people | 6% |
Top Reasons (multiple answers allowed)
Usefulness of the Flowchart
The flowchart that is provided for completing the counting of the vote was considered useful, with officers from Atlantic Provinces being significantly more likely (95%) and those from Alberta being significantly less likely (87%) to say that it was very useful or somewhat useful, compared to 91% overall.
| Total | ATL. | QC | ON | MAN | SASK | AB | BC | TER.* | N. of 50th | STUDENT RES.* | |
|---|---|---|---|---|---|---|---|---|---|---|---|
| Very useful | 67% | 73%+ | 73%+ | 66% | 62% | 65% | 54%- | 62% | 59% | 70% | 72% |
| Somewhat useful | 25% | 22% | 20%- | 25% | 32% | 29% | 32%+ | 26% | 36% | 26% | 28% |
| Not very useful | 5% | 4% | 3%- | 6% | 5% | 3% | 8% | 9%+ | 0% | 3% | 0% |
| Not at all useful | 2% | 1% | 2% | 2% | 0% | 3% | 3% | 3% | 0% | 0% | 0% |
Deputy returning officers only.
*Caution should be used when interpreting results due to small sample.
Deputy returning officers at mobile polls were less likely to state that the flowchart provided had been very useful (57%), and more likely to say it had not been very useful (9%).
| Total | Advance | Ordinary | Mobile | |
|---|---|---|---|---|
| Very useful | 67% | 65% | 67% | 57%- |
| Somewhat useful | 25% | 27% | 24% | 29% |
| Not very useful | 5% | 0% | 6%+ | 9%+ |
| Not at all useful | 2% | 5% | 2%- | 2% |
Deputy returning officers only.
Disposing of the Lists of Electors
More than half of deputy returning officers (52%) said that, at the time of closing their polls, they returned the lists of electors into the yellow bag, 13% in the box and 5% in the prescribed envelope. Fifteen percent (15%) reported giving them to a supervisor for disposal. A variety of other answers were also provided.
Some regional variance occurred. In Quebec, deputy returning officers were more likely to report giving them to a supervisor for disposal (20%) or to have put them in the box (16%). Quebec deputy returning officers were less likely to have reported moving the lists back in the provided yellow bag (47%), as were Saskatchewan deputy returning officers (41%).
Deputy returning officers at the advance polls (27%) and mobile polls (23%) were more likely to report they gave the lists to a supervisor for disposal compared to those at ordinary polls (13%).
| Total | |
|---|---|
| Moved back in the provided yellow bag | 52% |
| Given to a supervisor for disposal | 15% |
| I put it in the box | 13% |
| In the envelope | 5% |
| I followed the instructions | 2% |
| Took it to the returning office | 2% |
| Put into a garbage recipient at the polling site | 1% |
| Brought home to be disposed of in a secure fashion | 1% |
| Other | 1% |
| I don't know | 8% |
Deputy returning officers only.