 Site Menu
Survey of Electors Following the October 26, 2020, By-election in Toronto Centre and York Centre (Ontario)
Detailed Findings
1. Awareness of the By-election and Voter Information
Majority were aware a federal by-election took place on October 26, 2020
Eighty-nine percent (89%) of electors surveyed said that they were aware that a federal by-election took place on October 26, 2020, in their riding.
Figure 1: Awareness of By-election
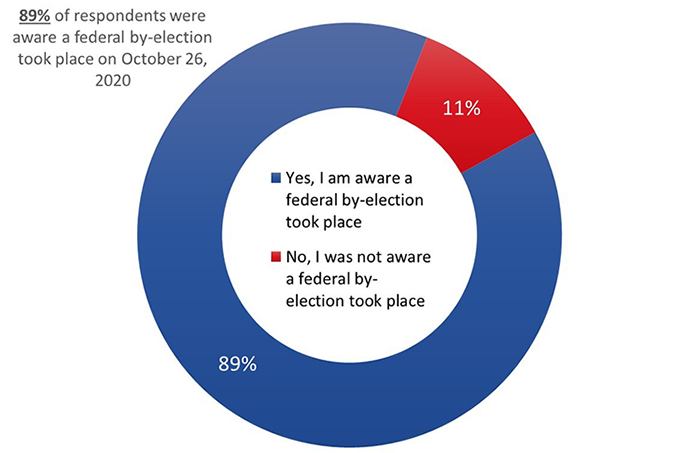
Q1. Did you know that a federal by-election took place on October 26, 2020, in your riding?
Base: n=804; all respondents.
Text version of "Figure 1: Awareness of By-election"
Q1. Did you know that a federal by-election took place on October 26, 2020, in your riding? Base: n=804; all respondents.
This pie chart shows the breakdown of answers: 89% of respondents said they were aware that a federal by-election took place on October 26, 2020; 11% were not aware that a federal by-election had taken place.
Awareness of the October 26, 2020, federal by-election was higher among the following subgroups:
- Electors in the York Centre riding (93%), as opposed to 85% of those in Toronto Centre.
- Those aged 55 and over (95%), as opposed to younger electors aged 18 to 24 (82%), 25 to 34 (84%), or 35 to 54 (88%).
- Electors with some post-secondary education or who have completed college (94%), as compared to those who completed university (88%).
- Students (98%) and retired electors (95%), as opposed to respondents who are employed (87%).
- Those who voted in the 2019 federal election (91%), versus 71% of those who did not vote in the 2019 election.
Widespread recall of Elections Canada advertising
A split sample was used to test electors' recall of Elections Canada advertisements for the October 26, 2020, federal by-election. One subset of respondents (n=395) was asked whether they recalled any advertising or communications from Elections Canada about how, when, and where to vote, a standard question used in previous post-electoral surveys. The other subset (n=409) was asked whether they recalled any advertising from Elections Canada about COVID-19 safety measures in place at the polls.
Ninety-one percent (91%) of electors recalled advertising from Elections Canada informing them where, when, and how to vote. Fewer (85%), but still a strong majority, recalled Elections Canada advertising about COVID-19 safety measures at the polls.
Figure 2: Recall of Elections Canada Advertisements

[LEFT] Q30. During the by-election campaign, have you seen or heard advertising from Elections Canada about where, when, and how to vote? Base: n=395. Split sample.
[RIGHT] Q31. During the by-election campaign, have you seen or heard advertising from Elections Canada about COVID-19 safety measures in place at the polls? Base: n=409; all respondents. Split sample.
Text version of "Figure 2: Recall of Elections Canada Advertisements"
[LEFT] Q30. During the by-election campaign, have you seen or heard advertising from Elections Canada about where, when, and how to vote? Base: n=395. Split sample.
[LEFT] This pie chart shows the breakdown of answers: 91% of respondents saw or heard advertising from Elections Canada about where, when and how to vote; 9% said they did not see or hear advertising from Elections Canada.
[RIGHT] Q31. During the by-election campaign, have you seen or heard advertising from Elections Canada about COVID-19 safety measures in place at the polls? Base: n=409; all respondents. Split sample.
[RIGHT] This pie chart shows the breakdown of answers: 85% of respondents saw or heard Elections Canada's advertising about COVID-19 safety measures; 15% of respondents said they did not see or hear advertising about COVID-19 safety measures.
The likelihood of recalling any advertising or communications from Elections Canada was higher among electors in the York Centre riding (95%) compared to those in the Toronto Centre riding (88%).
Those who voted at an advance polling station (92%) were more likely to recall having seen or heard advertising from Elections Canada about COVID-19 safety measures compared to those who voted at a polling station on election day (82%).
Source of advertising recall is varied
The same split sample was used to determine electors' source of recall of Elections Canada advertising during the campaign. Nearly one-quarter (23%) recalled hearing advertising from Elections Canada about where, when, and how to vote on the radio or an audio platform such as Spotify. This was followed closely by social media (21%) and browsing online or on a mobile application (19%). Fifteen percent (15%) reported seeing ads about where, when, and how to vote in a local newspaper.
More than one-quarter of respondents said they saw Elections Canada's advertising about COVID-19 safety measures at the polls while browsing or on a mobile application (28%) or on social media (27%). Fewer than one in five (19%) recalled hearing EC's advertising about COVID-19 safety measures on the radio or an audio platform. Thirteen percent (13%) reported seeing these ads in a local newspaper.
Figure 3: Recall of Elections Canada Advertising: By Source

Q30A-D. During the by-election campaign, have you seen or heard advertising from Elections Canada about where, when, and how to vote…? Base: n=395; all respondents. Split sample. [DK/NR: 6% - 9%.]
Q31A-D. During the by-election campaign, have you seen or heard advertising from Elections Canada about COVID-19 safety measures in place at the polls…? Base: 409. Split sample. [DK/NR: 0% - 8%.]
Text version of "Figure 3: Recall of Elections Canada Advertising: By Source"
Q30A-D. During the by-election campaign, have you seen or heard advertising from Elections Canada about where, when, and how to vote…? Base: n=395; all respondents. Split sample. [DK/NR: 6% - 9%.]
Q31A-D. During the by-election campaign, have you seen or heard advertising from Elections Canada about COVID-19 safety measures in place at the polls…? Base: 409. Split sample. [DK/NR: 0% - 8%.]
This horizontal bar chart shows respondents' recall of Elections Canada's advertising by source, comparing general advertising (blue bars) to COVID-19-specific advertising (grey bars). The breakdown is as follows:
- Total
- On the radio / audio platform:
- EC advertising: 23%
- COVID-19 advertising: 19%
- On social media:
- EC advertising: 21%
- COVID-19 advertising: 27%
- Browsing / on a mobile application:
- EC advertising: 19%
- COVID-19 advertising: 28%
- In a local newspaper:
- EC advertising: 15%
- COVID-19 advertising: 13 %
- On the radio / audio platform:
Notable subgroup differences regarding the source of recall for Elections Canada's general advertising during the campaign include the following:
- Those who were aware of the by-election were more likely than those not aware to recall seeing or hearing ads on social media (22% versus 8%) and when browsing or on a mobile application (21% versus 5%).
- Those who felt informed about the by-election were more likely than those who did not to recall seeing or hearing ads on social media (24% versus 5% of those who did not feel informed) and when browsing or on a mobile application (22% versus 8%).
- Voters were more likely than non-voters to report seeing this advertising when browsing or on a mobile application (24% versus 13% of non-voters) and hearing it on the radio or an audio platform (27% versus 13%).
- Electors from York Centre (29%) were more likely than those from Toronto Centre (16%) to mention radio or an audio platform as the source of their recall.
- One-quarter (25%) of electors aged 55 and older recalled seeing EC advertising in a local newspaper compared to 12% of respondents between the ages of 35 and 54 and 5% of those aged 25 to 34.
Notable subgroup differences regarding the source of recall for Elections Canada's COVID-19 safety measures advertising include the following:
- Those who received their VIC (23%) were more likely than those who did not (7%) to report having heard Elections Canada advertising about COVID-19 safety measures on the radio or an audio platform.
- Those who felt informed about the federal by-election (15%) were more likely than those who did not (1%) to have seen EC's advertising in a local newspaper.
- One in five (20%) electors aged 55 and older recalled seeing EC advertising in a local newspaper compared to 9% of respondents between the ages of 35 and 54 and 9% of those aged 25 to 34.
Majority felt informed about the voting process
Nearly nine in 10 (88%) electors aware of the by-election felt at least somewhat informed about how, when, and where to vote in the October 26, 2020, by-election, including two-thirds (66%) who said they felt very informed.
Figure 4: Knowledge of How, When, and Where to Vote

Q29. Overall, how well-informed do you feel you were about how, when, and where to vote? Base: n=737; those aware of the by-election [DK/NR: 1%.]
Text version of "Figure 4: Knowledge of How, When, and Where to Vote"
Q29. Overall, how well-informed do you feel you were about how, when, and where to vote? Base: n=737; those aware of the by-election [DK/NR: 1%.]
This vertical bar chart shows how well-informed respondents felt they were about how, when and where to vote in the by-election held on October 26, 2020. The breakdown is as follows:
- Total
- Very informed: 66%
- Somewhat informed: 22%
- Somewhat uninformed: 6%
- Very uninformed: 5%
In total, 88% felt informed about how, when and where to vote.
The likelihood of feeling somewhat or very informed about how, when, and where to vote was higher among:
- Those who voted in the by-election (94% versus 73% of those who did not vote).
- Those who received a VIC addressed to them personally (94% versus 44% of those who did not).
- Those with persons under 18 years of age living in their home (94% versus 86% of those who do not).
In addition, the following respondents were more likely to feel very informed:
- Electors aged 35 to 54 (72%) and aged 55+ (74%) compared to those between the ages of 25 and 34 (52%).
- Electors who completed high school or less (76%) compared to those who completed college or some university (61%).
One in five visited EC's website; majority were satisfied with their experience
One in five (20%) electors visited Elections Canada's website during the campaign. Among those who visited the website, more than nine in 10 (92%) were satisfied with the information it provided, including nearly two-thirds (63%) who said they were very satisfied.
Figure 5: Elections Canada Website

Q32 [LEFT]. Did you visit Elections Canada's website during the campaign? Base: n=804; all respondents. [DK/NR: 1%.]
Q33 [RIGHT]. Overall, how satisfied were you with the information on Elections Canada's website? Would you say that you were…? Base: n=141; respondents who visited EC's website. [DK/NR: 2%.]
Text version of "Figure 5: Elections Canada Website"
Q32 [LEFT]. Did you visit Elections Canada's website during the campaign? Base: n=804; all respondents. [DK/NR: 1%.]
[LEFT] This pie chart shows the breakdown of answers: 20% of respondents visited Elections Canada's website during the campaign; 79% said they did not visit Elections Canada's website.
Q33 [RIGHT]. Overall, how satisfied were you with the information on Elections Canada's website? Would you say that you were…? Base: n=141; respondents who visited EC's website. [DK/NR: 2%.]
[RIGHT] This vertical bar chart shows the level of satisfaction with the information on Elections Canada's website. The breakdown is as follows:
- Total
- Very satisfied: 63%
- Somewhat satisfied: 29%
- Somewhat dissatisfied: 3%
- Very dissatisfied: 3%
In total, 92% were satisfied with the information on Elections Canada's website.
The likelihood of visiting Elections Canada's website during the campaign was higher among
the following subgroups:
- Men (25% versus 16% of women).
- Electors aged 25 to 34 (30%) compared to those aged 35 to 54 (18%) and aged 55+ (15%).
- Electors who completed university (23%) compared to those who completed high school or less (14%).
- Unemployed electors (34%) compared to retired electors (14%).
Electors' satisfaction with the information provided on Elections Canada's website was widespread – there are no notable subgroup differences to report.
Very few contacted Elections Canada, but many of those who did were satisfied with the information
Five percent (5%) of electors aware of the by-election said they contacted Elections Canada during the campaign. Among those who contacted EC, 84% were satisfied with the information they were provided, including 70% who were very satisfied.
Figure 6: Contact with Elections Canada

Q34 [LEFT]. Did you contact Elections Canada during the campaign?
Base: n=804; all respondents.
Q35 [RIGHT]. Overall, how satisfied were you with the information provided when you contacted Elections Canada?
Base: n=41; respondents who contacted EC. [DK/NR: 1%.]
Text version of "Figure 6: Contact with Elections Canada"
Q34 [LEFT]. Did you contact Elections Canada during the campaign? Base: n=804; all respondents.
[LEFT] This pie chart shows the breakdown of answers: 5% of respondents contacted Elections Canada during the campaign; 95% said they did not contact Elections Canada.
Q35 [RIGHT]. Overall, how satisfied were you with the information provided when you contacted Elections Canada? Base: n=41; respondents who contacted EC. [DK/NR: 1%.]
[RIGHT] This vertical bar chart shows the level of satisfaction with the information provided by Elections Canada. The breakdown is as follows:
- Total
- Very satisfied: 70%
- Somewhat satisfied: 14%
- Somewhat dissatisfied: 5%
- Very dissatisfied: 10%
In total, 84% were satisfied with the information provided when they contacted Elections Canada.
There are no significant subgroup differences to report.
2. Voter Information Card and Voter Registration
Many electors received a VIC
Nearly nine in 10 (88%) electors received a Voter Information Card, or VIC, addressed to them personally, telling them where and when to vote.
Figure 7: Receipt of Voter Information Card

Q4. During the campaign, did you receive a voter information card addressed to you personally and telling you where and when to vote?
Base: n=737; those who said they were aware of the by-election.
Text version of "Figure 7: Receipt of Voter Information Card"
Q4. During the campaign, did you receive a voter information card addressed to you personally and telling you where and when to vote? Base: n=737; those who said they were aware of the by-election.
This pie chart shows the breakdown of answers: 88% of respondents received a voter information card telling them where and when to vote; 10% said they did not receive a voter information card; 2% said they don't know or can't recall if they received a voter information card.
The following groups of electors were more likely to say they received a VIC:
- Electors in the York Centre riding (93%) compared to those in Toronto Centre (83%).
- Electors aged 35+ (94% versus 81% of those 25 to 34 years of age).
- Those who voted in the by-election (95% versus 72% of non-voters).
- Those who felt informed about the by-election (94% versus 44% of those who did not).
Nearly all electors (97%) who received a VIC reported it had the correct name and everyone (100%) indicated that it included the correct address. There are no subgroup differences to report.
Vast majority who received a VIC brought it with them to the polling place
More than nine in 10 (95%) electors who voted at an Elections Canada office, advance poll, or polling station on election day said they brought their VIC with them.
Figure 8: Voter Information Card – Brought to Vote

Q22. Did you bring your voter information card with you to the polling station/advance polling station/local Elections Canada office?
Base: n=508; respondents who received their VIC and voted in person.
Text version of "Figure 8: Voter Information Card – Brought to Vote"
Q22. Did you bring your voter information card with you to the polling station/advance polling station/local Elections Canada office? Base: n=508; respondents who received their VIC and voted in person.
This pie chart shows the breakdown of answers: 95% of respondents who received a voter information card brought it with them to vote; 5% of respondents who received a voter information card did not bring it with them to vote.
There are no subgroup differences to report.
Almost six in 10 who did not receive a VIC did nothing to find out if they were registered
Nearly six in 10 (57%) electors who did not receive a VIC during the campaign did nothing to find out whether they were registered to vote in the by-election. Most people who took action consulted the Elections Canada website (5%) or called the 1-800 Elections Canada phone number (5%). Approximately one in 10 (9%) checked their registration status at the polling station or a local Elections Canada office. Very few took other steps.
Figure 9: Steps Taken to Find Out Whether Registered to Vote

Q7. What did you do to find out whether you were registered to vote in this by-election?
Base: n=65; respondents who did not receive a VIC. [DK/NR: 5%.]
Text version of "Figure 9: Steps Taken to Find Out Whether Registered to Vote"
Q7. What did you do to find out whether you were registered to vote in this by-election? Base: n=65; respondents who did not receive a VIC. [DK/NR: 5%.]
This horizontal bar chart shows the various ways respondents who did not receive a voter information card checked whether they were registered to vote in this by-election. The breakdown is as follows:
- Total
- Found out at the polling station/local Elections Canada office: 9%
- Consulted the Elections Canada website: 5%
- Called 1 800 number of Elections Canada: 5%
- Used Online Voter Registration Service: 3%
- Learned from my voter information card: 1%
- Did nothing: 57%
- Other: 16%
The likelihood of doing nothing was higher among those who felt uninformed about the by-election (72% versus 39% of those who felt informed) and those who did not vote in the by-election (72% versus 24% of voters).
Seven in 10 knew electors need to be registered to vote
Approximately seven in 10 (69%) electors knew that they must first be registered on the list of electors to vote in a Canadian federal election. Just over one in five (22%) said they do not need to be registered to vote, and 9% were unsure.
Figure 10: Awareness of Registration Requirement to Vote

Q8. To the best of your knowledge, do electors need to be registered on the list of electors to vote in a Canadian federal election?
Base: n=804; all respondents.
Text version of "Figure 10: Awareness of Registration Requirement to Vote"
Q8. To the best of your knowledge, do electors need to be registered on the list of electors to vote in a Canadian federal election? Base: n=804; all respondents.
This horizontal bar chart shows the breakdown of respondents' awareness of voter registration requirements. The breakdown is as follows:
- Total
- Yes: 69%
- No: 22%
- Don't know / no response: 9%
Electors with high school or less (78%) and those with some post-secondary education or who completed college (75%) were more likely than university graduates (65%) to report that eligible voters need to be registered on the list of electors to vote in a Canadian federal election. In addition, those who did not vote in the 2019 federal election (86%) were more likely than those who did vote (66%) to know that electors need to be registered to vote.
Three-quarters were aware electors can register at the polling place and vote
Nearly three-quarters of respondents (74%) were aware that electors can register at the polling place and then vote immediately after. In contrast, 11% were not aware that this is possible, and 15% said they did not know one way or the other.
Figure 11: Election Day Registration

Q9_merged. If an elector is not registered on election day and wants to vote, can they register at the polling place and then vote immediately after?
Base: n=804; all respondents.
Text version of "Figure 11: Election Day Registration"
Q9_merged. If an elector is not registered on election day and wants to vote, can they register at the polling place and then vote immediately after? Base: n=804; all respondents.
This horizontal bar chart shows respondents' awareness of election day registration. The breakdown is as follows:
- Total
- Yes: 74%
- No: 11%
- Don't know / no response: 15%
The following subgroups were more likely to report that electors can register at the polling place and vote immediately after:
- Those in the Toronto Centre riding (83%) compared to those in York Centre (66%).
- Electors aged 25 to 34 (86%) compared to those aged 35 to 54 (73%) and 55+ (67%).
- Electors who have completed university (78%) versus those with a high school education or less (64%).
- Electors who are unemployed (84%) or employed (77%) compared to retired electors (63%).
Six in 10 say electors can check, update, or complete their registration online
Slightly more than six in 10 (62%) said that an elector can check, update, or complete their voter registration on Elections Canada's website; fewer (8%) said electors cannot do so. In contrast, a significant minority (30%) said they don't know if an elector can check, update, or complete their registration on Elections Canada's website.
Figure 12: Awareness of Online Voter Registration

Q10. To the best of your knowledge, is it possible for Canadian electors to check, update, or complete their voter registration on Elections Canada's website?
Base: n=804; all respondents.
Text version of "Figure 12: Awareness of Online Voter Registration"
Q10. To the best of your knowledge, is it possible for Canadian electors to check, update, or complete their voter registration on Elections Canada's website? Base: n=804; all respondents.
This horizontal bar chart shows respondents' awareness of online voter registration. The breakdown is as follows:
- Total
- Yes: 62%
- No: 8%
- Don't know: 30%
The following subgroups were more likely to report that electors can check, update, or complete their voter registration on Elections Canada's website:
- Electors in the Toronto Centre riding (66%) as opposed to those in York Centre (58%).
- Younger electors (77% of those 18 to 24 and 71% of those 25 to 34) versus 56% of respondents aged 55+.
- Electors who have completed university (65%) compared to those with a high school education or less (51%).
- Electors who are employed (63%) compared to retirees (54%).
3. Voting and Voter Participation
Seven in 10 say they voted in the federal by-election
Seven in 10 electors (70%) who were aware of the by-election held on October 26, 2020, in their riding said they voted in it.[1]
Figure 13: By-election Voter Participation

Q2. Which of the following statements describes you?
Base: n=737; those who said they were aware of the by-election.
Text version of "Figure 13: By-election Voter Participation"
Q2. Which of the following statements describes you? Base: n=737; those who said they were aware of the by-election.
The horizontal bar chart shows the breakdown of voter participation in the October 26, 2020, by-election among respondents who were aware a by-election was taking place. The breakdown is as follows:
- Total
- I am sure I voted in the election: 70%
- I usually vote but did not this time: 16%
- I thought about voting but did not: 6%
- I did not vote in the election: 8%
The likelihood of voting was higher among:
- Those in the York Centre riding (75%) compared to those in Toronto Centre (65%).
- Electors aged 55 and older (76%) compared to those aged 25 to 34 (60%).
- Those who do not have people under the age of 18 living in their household (72%) compared to those who do (62%).
- Those who received a VIC (75%) compared to those who did not (26%).
- Respondents who reported feeling informed about the by-election (75%) compared to those who felt uninformed (31%).
- Electors who voted in the 2019 federal election (73%) compared to non-voters (32%).
Everyday life or health reasons are the main reasons for not voting in the by-election
Among respondents who said they did not vote in the by-election (n=199), one-third (34%) said they did not do so due to everyday life or health reasons. Nearly a quarter (23%) did not vote due to political reasons. Respondents also mentioned reasons related to the electoral process (17%) and reasons related to the pandemic (15%). Other reasons (11%) for not voting in the by-election included moving in or out of the riding and unhappiness with the performance of the government, among other reasons cited.
Figure 14: Main Reasons for Not Voting – Themes

Q3. What is the main reason you did not vote?
Base: n=199; respondents who did not vote. DK/NR: <0.5%.
Text version of "Figure 14: Main Reasons for Not Voting – Themes"
Q3. What is the main reason you did not vote? >Base: n=199; respondents who did not vote. DK/NR: <0.5%.
This horizontal bar chart shows the main reasons respondents gave for not voting. The responses have been grouped by theme. The breakdown is as follows:
- Total
- Pre-election everyday life or health reasons: 34%
- Political reasons: 23%
- Electoral process-related reasons: 17%
- Pandemic-related reasons: 15%
- Other reasons: 11%
The likelihood of not voting due to reasons related to the electoral process was higher among those who felt uninformed (33% versus 11% of those who felt informed) and those who did not receive their VIC (41% versus 9% of those who did).
Figure 15 provides a detailed breakdown of the reasons why electors did not vote in the October 26, 2020, federal by-election.
Figure 15: Main Reasons for Not Voting – Breakdown
| Reasons for Not Voting in October 26 By-election | % |
|---|---|
| Everyday life or health reasons | 34 |
| Too busy | 24 |
| Illness or disability | 6 |
| Out of town | 4 |
| Political reasons | 23 |
| Lack of information about campaign issues and parties' positions | 8 |
| Did not like candidates/parties/campaign | 7 |
| Felt voting would not make a difference | 4 |
| Not interested in politics | 3 |
| Did not know whom to vote for | <0.5 |
| Electoral process-related reasons | 17 |
| Lack of information about voting process (e.g. when/where to vote) | 10 |
| Transportation problem/polling station too far | 3 |
| Could not prove identity or address | 2 |
| Not on voters list | 1 |
| Issues with VIC | 1 |
| Pandemic-related reasons | 15 |
| Did not feel safe/comfortable going to vote due to COVID-19 | 15 |
| Did not believe an election should have taken place during the pandemic | <1 |
| Other reasons | 11 |
| Forgot to vote | 5 |
| Other reasons | 5 |
Electors are aware of common voting methods
A split sample was used to test questions designed to measure electors' knowledge of current voting methods. One sample of respondents (n=394) was asked to identify the current ways that electors can vote in a federal election. The other sample (n=406) was asked a set of two questions. First, they were asked how someone can vote in a federal election, and then they were asked if there are ways electors can cast a vote ahead of time.[2]
As the graphs in Figure 16 depict, both formulations yielded similar results. The one noteworthy difference is that the second formulation resulted in a higher proportion of respondents saying they do not know (specifically, 12% responded this way to the second question in the set and 5% to the first question).
Figure 16: Knowledge of Voting Methods

[LEFT] Q11. To the best of your knowledge, what are the current ways that electors can vote in a federal election? (Multiple responses accepted.)
Base: n=394. Split sample.
[RIGHT] Q11b/11c. If someone wants to vote in a federal election, how can they do so? (Multiple responses accepted.)
Base: n=406. Split sample.
Text version of "Figure 16: Knowledge of Voting Methods"
[LEFT] Q11. To the best of your knowledge, what are the current ways that electors can vote in a federal election? (Multiple responses accepted.) Base: n=394. Split sample.
[Left] This horizontal bar chart shows a split sample of the current ways respondents mentioned that an elector can vote in a federal election. The breakdown is as follows:
- Total
- Polling station on election day: 88%
- Advance polling station: 63%
- Mail: 44%
- Online: 6%
- Local Elections Canada office: 5%
- At home: 1%
- Mobile poll: 1%
- Other: 4%
- Don't know / no response: 5%
[RIGHT] Q11b/11c. If someone wants to vote in a federal election, how can they do so? (Multiple responses accepted.) Base: n=406. Split sample.
[Right] This horizontal bar chart shows a split sample of the current ways respondents mentioned an elector can vote in a federal election. The breakdown is as follows:
- Total
- Polling station on election day: 85%
- Advance polling station: 60%
- Mail: 39%
- Local Elections Canada office: 4%
- By proxy: 2%
- Mobile poll: 2%
- Phone: 2%
- At home: 2%
- Online: 1%
- Other: 5%
- Don't know / no response: 12%
Notable subgroup differences include the following:
- Awareness of the possibility of voting at a polling station on election day was higher among:[3]
- Respondents who live in the Toronto Centre riding (90% versus 83% of those living in the York Centre riding).
- Those who completed university (91% compared to 82% of respondents who have some post-secondary education or who completed college and 75% of respondents with high school or less education).
- Students (93%) and those who are employed (89%) compared to those who are retired (75%).
- Awareness of the possibility of voting at an advanced polling station was higher among:
- Those who completed university (66% compared to 46% of respondents with high school or less education).
- Those who were aware of the federal by-election on October 26 (65% versus 34% of respondents who were not aware), those who voted in the by-election (72% versus 48% of non-voters), and those who felt informed about the by-election (67% versus 46% who felt uninformed).
- Those who voted in the 2019 federal general election (64% versus 44% who did not vote).
- Awareness of the possibility of voting by mail was higher among:
- Respondents living in the Toronto Centre riding (49% versus 35% of those living in the York Centre riding).
- Electors aged 25 to 34 (63% versus 39% of 35 to 54-year-olds and 32% of those aged 55+).
- University graduates (48%) and those who completed some post-secondary or college (33%) compared to electors who completed high school or less (19%).
In addition, those with a functional disability were less likely to be aware that electors can vote at advance polls or by mail: 48% of respondents with a functional disability knew about advance polls versus 63% of those without a functional disability, and 30% knew electors can vote by mail, versus 43% of those who do not have a functional disability.
Voting on election day and at advance polling station remain popular voting methods
Electors who said they voted were most likely to have reported doing so at a polling station on election day (55%) or at an advance polling station (43%).[4] Very few reported voting at a local Elections Canada office (1%), by mail (0.4%), or at home (0.3%).
Figure 17: Methods Used to Vote

Q12. Which method did you use to vote?
Base: n=536; respondents who voted. [DK/NR: 1%.]
Text version of "Figure 17: Methods Used to Vote"
Q12. Which method did you use to vote? Base: n=536; respondents who voted. [DK/NR: 1%.]
This horizontal bar chart shows the breakdown of methods respondents used to vote. The breakdown is as follows:
- Total
- Polling station on election day: 55%
- Advance polling station: 43%
- Local Elections Canada office: 1%
- By mail: less than 0.5%
- At home: less than 0.5%
Electors who voted at a polling station on election day were more likely to identify as female (60%) than male (50%), between the ages of 35 and 54 (63%) rather than 55+ (47%), and employed (59%) rather than retired (54%).
Electors who voted at the advance polling station were more likely to be aged 55+ (50%) than between the ages of 35 and 54 (34%) and retired (53%) as opposed to employed (39%).
4. Voter Identification
Widespread awareness of identification requirements
A split-sample approach was used to measure awareness of identification requirements for voting. Traditionally, post-electoral surveys ask respondents whether they need proof of identity to vote, and then the question is repeated for proof of address. In previous post-electoral surveys, this formulation resulted in very high awareness levels for both requirements. However, survey pre-tests suggested that some respondents did not perceive a difference between the two (i.e., between proof of address and proof of identity). Thus, a second version of this question was developed, asking respondents whether, to the best of their knowledge, electors need proof of identity, proof of address, both, or none. The two formulations were compared using the aforementioned split-sample experiment.
As has been the case with previous surveys, the first formulation found that the vast majority of respondents think that electors have to present proof of identity (96%) or proof of address (89%) in order to vote in a Canadian election. Of those asked the second formulation, 84% correctly responded that both proof of both identity and address are required to vote in a Canadian federal election. Eleven percent indicated that only proof of identity was needed and 1% that neither was needed.
Figure 18: Awareness of Voter Identification Requirements

[LEFT] Q14B_merged. Do voters have to present a proof of IDENTITY in order to vote in a Canadian federal election? Split sample: n=415.
[LEFT] Q15. Do voters have to present a proof of ADDRESS in order to vote in a Canadian federal election? Split sample: n=415.
[RIGHT] Q14A. In order to vote at a federal election, must electors provide …?
Base: n=388. Split sample. [DK/NR: 2%.]
Text version of "Figure 18: Awareness of Voter Identification Requirements"
[LEFT] Q14B_merged. Do voters have to present a proof of IDENTITY in order to vote in a Canadian federal election? Split sample: n=415.
[LEFT] Q15. Do voters have to present a proof of ADDRESS in order to vote in a Canadian federal election? Split sample: n=415.
[Left] This vertical bar chart shows a split sample breakdown of respondents' awareness of voter identification requirements. The breakdown is as follows:
- Total
- Yes, voters have to present a proof of identity: 96%
- Don't know: 1%
- Yes, voters have to present a proof of address: 89%
- Don't know: 5%
[RIGHT] Q14A. In order to vote at a federal election, must electors provide …? Base: n=388. Split sample. [DK/NR: 2%.]
[Right] This vertical bar chart shows a split sample breakdown of respondents' awareness of voter identification requirements. The breakdown is as follows:
- Total
- Neither: 1%
- Both: 84%
- A proof of address only: 1%
- A proof of identity only: 11%
- Don't know: 2%
The results of this split-sample test confirm the results of the six previous by-election surveys[5] and that the new formulation leads to results that better reflect respondents' grasp of voter identification requirements.
There are no subgroup differences to report.
Virtually all voters found it easy to meet the identification requirements
Virtually all (99%) respondents who voted in the by-election held on October 26, 2020, found it easy to meet the identification requirements, with the vast majority (94%) describing it as very easy.
Figure 19: Ease of Meeting Voter Identification Requirements

Q16. Overall, how easy was it to meet the identification requirements?
Base: n=528; respondents who voted at an advance poll, at a polling station on election day, or at an EC office. [DK/NR: <0.5%.]
Text version of "Figure 19: Ease of Meeting Voter Identification Requirements"
Q16. Overall, how easy was it to meet the identification requirements? Base: n=528; respondents who voted at an advance poll, at a polling station on election day, or at an EC office. [DK/NR: <0.5%.]
This vertical bar chart shows the ease of meeting the voter identification requirements. The breakdown is as follows:
- Total
- Very easy: 94%
- Somewhat easy: 5%
- Somewhat difficult: less than 0.5%
- Very difficult: less than 0.5%
In total, 99% found it easy to meet identification requirements.
The likelihood of saying that it was very easy to meet the identification requirements was higher among women (97% versus 92% of men), those who completed university (96% versus 87% of those with high school or less education), and those who are employed (97% versus 82% of unemployed voters).
5. Voter Experience
Vast majority of voters found it easy to vote
Ninety-eight percent of respondents who voted in the October 26, 2020, federal by-election found it easy to vote, with 89% saying it was very easy to vote.
Figure 20: Ease of Voting

Q13. Overall, how easy was it to vote? Would you say it was…?
Base: n=533; respondents who voted and identified a voting method. [DK/NR: 1%.]
Text version of "Figure 20: Ease of Voting"
Q13. Overall, how easy was it to vote? Would you say it was…? Base: n=533; respondents who voted and identified a voting method. [DK/NR: 1%.]
This vertical bar chart shows the ease of voting. The breakdown is as follows:
- Total
- Very easy: 89%
- Somewhat easy: 8%
- Somewhat difficult: 1%
- Very difficult: 1%
In total, 98% found it easy to vote during the October 26, 2020, by-election.
There are no subgroup differences to report.
Virtually all agreed that voting facilities were convenient to access, suitable, and had enough signs
As is the case with previous by-election surveys, nearly everyone surveyed who voted in the by-election said the polling station, advance polling station, or Elections Canada office was a convenient distance from their home (92%) and that the facility was suitable (97%). Additionally, respondents who voted at a polling station or at a local Elections Canada office said there were enough signs in the facility to help them find where to go to vote (93%).
The likelihood of saying that the building where electors voted was very suitable was higher among women (90% than 78% of men) and those who have high school or less education and those who completed university (93% and 86%, respectively, compared to 75% of those who have some post-secondary education or who completed college).
Almost everyone said COVID-19 safety measures made them feel safe
Ninety-eight percent (98%) of voters who voted at a polling station or at a local Elections Canada office said the COVID-19 safety measures in place made them feel safe, with 78% saying the measures made them feel very safe.
Figure 21: COVID-19 Safety Measures

Q20. When thinking about the safety measures in place at the (place voted) in response to the COVID-19 pandemic, would you say that they made you feel…
Base: n=528; respondents who voted at an advance poll, at a polling station on election day or at a local Elections Canada office. [DK/NR: <0.5%.]
Text version of "Figure 21: COVID-19 Safety Measures"
Q20. When thinking about the safety measures in place at the (place voted) in response to the COVID-19 pandemic, would you say that they made you feel… Base: n=528; respondents who voted at an advance poll, at a polling station on election day or at a local Elections Canada office. [DK/NR: <0.5%.]
The vertical bar chart shows how safe respondents who voted at an advance poll, at a polling station or at an Elections Canada office felt in terms of the safety measures in place in response to COVID-19. The breakdown is as follows:
- Total
- Very safe: 78%
- Somewhat safe: 20%
- Somewhat unsafe: 2%
- Very unsafe: less than 0.5%
In total, 98% said the COVID-19 safety measures in place made them feel safe.
Voters who said that the safety measures made them feel very safe were more likely to:
- Reside in the Toronto Centre riding (83%) than in the York Centre riding (75%).
- Identify as female (83%) than male (74%).
- Be retired (87%) than employed (78%).
Most voters voted in the afternoon or evening
Of all voters surveyed (n=523), 72% reported voting between noon and 8:30 p.m. Over one-third (36%) voted in the afternoon (between noon and 4 p.m.) or in the evening (from 4 p.m. until the close of polls).
Of the voters who voted on election day (n=293), one-quarter (26%) reported doing so in the morning (from when the polls open until noon), one-quarter (26%) said they voted in the afternoon (between noon and 4 p.m.), and 42% indicated that they voted in the evening (from 4 p.m. until the close of polls).
Figure 22: Time of Day Voted [Election Day]
![Figure 22: Time of Day Voted [Election Day]](/res/rec/eval/byoct2020/images/fig22_e.png)
Q23. Do you remember approximately what time it was when you went to vote?
Base: n= 293; respondents who voted on election day. [DK/NR: 6%.]
*Election day poll hours: 8:30 a.m. to 8:30 p.m.
**Percentages may not add up to 100% due to rounding.
Text version of "Figure 22: Time of Day Voted [Election Day]"
Q23. Do you remember approximately what time it was when you went to vote? Base: n= 293; respondents who voted on election day. [DK/NR: 6%.]
*Election day poll hours: 8:30 a.m. to 8:30 p.m.
**Percentages may not add up to 100% due to rounding.
The horizontal bar chart shows the time of day that election day voters went to their polling station. The breakdown is as follows:
- Total
- Before 9 a.m.: 4%
- Between 9 and 10 a.m.: 5%
- Between 10 and 11 a.m.: 10%
- Between 11 a.m. and noon: 7%
- Between noon and 1 p.m.: 3%
- Between 1 and 2 p.m.: 7%
- Between 2 and 3 p.m.: 9%
- Between 3 and 4 p.m.: 7%
- Between 4 and 5 p.m.: 6%
- Between 5 and 6 p.m.: 14%
- Between 6 and 7 p.m.: 13%
- Between 7 and 8 p.m.: 8%
- After 8 p.m.: 1%
In total, 26% voted in the morning (by noon), 26% voted in the afternoon (between noon and 4 p.m.) and 42% voted in the evening (between 4 p.m. and the close of polls).
Half of those who voted at an advance polling station (n=230) on October 16, 17, 18, and 19, 2020 reported doing so in the afternoon (between noon and 4 p.m.). The single greatest proportion of these voters (19%) said they voted between noon and 1 p.m.
Figure 23: Time of Day Voted [Advance Polls]
![Figure 23: Time of Day Voted [Advance Polls]](/res/rec/eval/byoct2020/images/fig23_e.png)
Q23. Do you remember approximately what time it was when you went to vote? Base: n=230; respondents who voted at an advance poll. [DK/NR: 23%.]
*Election day poll hours: 12 p.m. to 8 p.m.
**Percentages may not add up to 100% due to rounding.
Text version of "Figure 23: Time of Day Voted [Advance Polls]"
Q23. Do you remember approximately what time it was when you went to vote? Base: n=230; respondents who voted at an advance poll. [DK/NR: 23%.]
*Election day poll hours: 12 p.m. to 8 p.m.
**Percentages may not add up to 100% due to rounding.
The horizontal bar chart shows the time of day that advance-poll voters went to vote. The breakdown is as follows:
- Total
- Between noon and 1 p.m.: 19%
- Between 1 and 2 p.m.: 11%
- Between 2 and 3 p.m.: 11%
- Between 3 and 4 p.m.: 9%
- Between 4 and 5 p.m.: 5%
- Between 5 and 6 p.m.: 9%
- Between 6 and 7 p.m.: 2%
- Between 7 and 8 p.m.: 12%
In total, 50% voted between noon and 4 p.m., and 28% voted between 4 p.m. and the closing of the polls.
There are no subgroup differences to report.
Nearly six in 10 said it took five minutes or less to vote
Fifty-seven percent of respondents who voted in the by-election said that voting took them five minutes or less. This applied to electors who voted at a polling station on election day or at an advance poll. Most of the rest said that it took them somewhere between six and 15 minutes to vote, either on election day or at an advance poll.
The likelihood of saying it took less than five minutes to vote, whether on election day or at an advance poll, was higher among those who reside in the York Centre riding (63%) than in the Toronto Centre riding (50%).
Figure 24: Length of Time to Vote

Q24. To the best of your knowledge, how long did it take you to vote at the polling station/advance polling station/local Elections Canada office? This does not include travel time.
Base: n=528; respondents who voted at an advance poll or at a polling station on election day and recalled the time of day they voted.
Text version of "Figure 24: Length of Time to Vote"
Q24. To the best of your knowledge, how long did it take you to vote at the polling station/advance polling station/local Elections Canada office? This does not include travel time. Base: n=528; respondents who voted at an advance poll or at a polling station on election day and recalled the time of day they voted.
The horizontal bar chart shows the length of time it took to vote, comparing election day voters (blue bars) to advance-poll voters (grey bars). The breakdown is as follows:
- Total
- 5 minutes or less:
- Election day: 57%
- Advance poll: 57%
- 6 to 10 minutes:
- Election day: 26%
- Advance poll: 23%
- 11 to 15 minutes:
- Election day: 11%
- Advance poll: 9%
- 16 to 20 minutes:
- Election day: 5%
- Advance poll: 6%
- 21 to 30 minutes:
- Election day: 2%
- Advance poll: 3%
- More than 30 minutes:
- Election day: less than 0.5%
- Advance poll: 3%
- 5 minutes or less:
In total, 50% voted between noon and 4 p.m., and 28% voted between 4 p.m. and the closing of the polls.
Virtually all (97%) voters found the time taken to vote to be reasonable. There are no subgroup differences to report.
Satisfaction with Elections Canada staff was strong and widespread
Ninety-seven percent (97%) of those who voted at an advance poll, on election day, or in a local Elections Canada office were satisfied with the services provided by Elections Canada staff, including 88% who said they were very satisfied.
Figure 25: Satisfaction with Elections Canada Staff

Q28. Overall, how satisfied were you with the services provided by Elections Canada staff when you voted? Would you say they were…?
Base: n=528; respondents who voted at an advance poll, at a polling station on election day, or an EC office. [DK/NR: 1%.]
Text version of "Figure 25: Satisfaction with Elections Canada Staff"
Q28. Overall, how satisfied were you with the services provided by Elections Canada staff when you voted? Would you say they were…? Base: n=528; respondents who voted at an advance poll, at a polling station on election day, or an EC office. [DK/NR: 1%.]
This vertical bar chart shows respondents' satisfaction with the services provided by Elections Canada staff when they voted. The breakdown is as follows:
- Total
- Very satisfied: 88%
- Somewhat satisfied: 9%
- Somewhat dissatisfied: 2%
- Very dissatisfied: less than 0.5%
In total, 97% were satisfied with the services provided by Elections Canada staff.
Voters who completed high school or less (98%) were more likely than voters with some post-secondary education or those who completed college (85%) and university graduates (88%) to say they were very satisfied with Elections Canada staff.
Almost all voters surveyed chose to be served in English (99%). All voters were satisfied with the service they received in their chosen official language.
Virtually all voters satisfied with voting experience
Nearly all (97%) respondents who voted in the by-election were satisfied with their overall voting experience, with 81% saying that they were very satisfied.
Figure 26: Satisfaction with Overall Voting Experience

Q36. Overall, how satisfied were you with your voting experience?
Base: n=536; all respondents who voted. [DK/NR: 1%.]
Text version of "Figure 26: Satisfaction with Overall Voting Experience"
Q36. Overall, how satisfied were you with your voting experience? Base: n=536; all respondents who voted. [DK/NR: 1%.]
This vertical bar chart shows respondents' satisfaction with the voting experience. The breakdown is as follows:
- Total
- Very satisfied: 81%
- Somewhat satisfied: 16%
- Somewhat dissatisfied: 2%
- Very dissatisfied: less than 1%
In total, 97% were satisfied with their voting experience.
Those who said they were very satisfied with their voting experience were more likely to feel informed (83%) about the federal by-election held on October 26, 2020, than those who felt uninformed (55%).
6. Fairness and Trust
Vast majority think Elections Canada ran the by-election fairly
Respondents were asked two variations of a question about the fairness with which Elections Canada runs federal by-elections. Half of survey respondents (n=408) were asked the following question: "Thinking about the October 26, 2020, federal by-election, would you say that Elections Canada ran the election…?" The other half (n=396) was asked, "Thinking about federal by-elections in general, would you say that Elections Canada runs elections…?"
The more specific formulation (i.e. focusing on the October 26, 2020 by-election) found the majority of respondents (82%) thought that Elections Canada ran the election fairly, with two-thirds (65%) saying very fairly. The more general formulation yielded more positive results overall. More than nine in 10 (93%) said that Elections Canada runs elections fairly, with three-quarters (74%) saying very fairly. In previous by-election surveys[6] where this split-sample test was conducted, the main effect was that the more general formulation resulted in a noticeably lower proportion of electors saying that they did not know. The results from this by-election are consistent with those reported following the December 3, 2018, and February 25, 2019, by-elections.[7]
Figure 27: Perceptions of Elections Canada's Fairness

Q37A [LEFT]. Thinking about the October 26, 2020, federal by-election, would you say that Elections Canada ran the election…?
Base: n=408.
Split sample.
Q37B [RIGHT]. Thinking about federal by-elections in general, would you say that Elections Canada runs elections…?
Base: n=396.
Split sample.
Text version of "Figure 27: Perceptions of Elections Canada's Fairness"
Q37A [LEFT]. Thinking about the October 26, 2020, federal by-election, would you say that Elections Canada ran the election…? Base: n=408. Split sample.
[Left] This vertical bar chart shows a split sample breakdown of respondents' perception of the fairness of the 2020 federal by-election. The breakdown is as follows:
- Total
- Very fairly: 65%
- Somewhat fairly: 17%
- Somewhat unfairly: 4%
- Very unfairly: 2%
- Don't know: 12%
In total, 82% found the election ran fairly.
Q37B [RIGHT]. Thinking about federal by-elections in general, would you say that Elections Canada runs elections…? Base: n=396. Split sample.
[Right] This vertical bar chart shows a split sample breakdown of respondents' perception that, in general, federal by-elections are run fairly. The breakdown is as follows:
- Total
- Very fairly: 74%
- Somewhat fairly: 19%
- Somewhat unfairly: 2%
- Very unfairly: 2%
- Don't know: 4%
In total, 93% found the election was run fairly.
With the first formulation, the following subgroups were more likely to think that the October 26, 2020, by-election was run very fairly:
- Those who identify as male (71% versus 59% female).
- University graduates (69% versus 49% of those with high school or less education).
- Those who are retired (78% versus 64% of those who are employed).
- Those aware of the by-election (69% versus 32% of those not aware).
- Those who voted in the by-election (77% versus 49% of non-voters).
- Those who felt informed about the by-election (73% versus 37% of those who did not).
With the second formulation, there were fewer subgroup differences of note:
- Electors aged 55+ (81%) were more likely than electors aged 35 to 54 (71%) to say they felt the election was run very fairly.
- Compared to non-voters (63%), those who voted in the by-election (80%) were more likely to think that the election was run very fairly.
Majority trusts the accuracy of by-election results
A split-sample approach was also used to survey electors about trust in the accuracy of the by-election results. As in previous waves of the survey,[8] half of respondents (n=397) were asked, "What level of trust do you have in the accuracy of the election results in your riding?" The other half (n=407) was asked a similar question: "What level of trust do you have in the accuracy of the election results?" but it was prefaced by the following preamble: "At the end of a federal election, poll workers in each riding count ballots by hand and report the results to Elections Canada."
As figure 28 indicates, both formulations of the question yielded similar overall results. For each formulation, 94% said their level of trust is high, including seven in 10 who said it was very high – 72% who were asked the first formulation and 70% who were asked the second formulation. In previous waves of the survey, the first formulation of the question yielded higher proportions saying they have a very high level of trust in the election results. However, this wave yielded similar results with both questions.
Figure 28: Trust in Accuracy of Results

Q38A [LEFT]. What level of trust do you have in the accuracy of the election results in your riding?
Base: n=397. Split sample.
Q38B [RIGHT]. At the end of a federal election, poll workers in each riding count ballots by hand and report the results to Elections Canada. What level of trust do you have in the accuracy of the election results? Is it …?
Base: n=407. Split sample.
Text version of "Figure 28: Trust in Accuracy of Results"
Q38A [LEFT]. What level of trust do you have in the accuracy of the election results in your riding? Base: n=397. Split sample.
[Left] This vertical bar chart shows a split sample breakdown of respondents' level of trust in the accuracy of the election results in their riding. The breakdown is as follows:
- Total
- Very high: 72%
- Somewhat high: 22%
- Somewhat low: 3%
- Very low: 1%
- Don't know: 2%
In total, 94% trust the accuracy of the election results.
Q38B [RIGHT]. At the end of a federal election, poll workers in each riding count ballots by hand and report the results to Elections Canada. What level of trust do you have in the accuracy of the election results? Is it …? Base: n=407. Split sample.
[Right] This vertical bar chart shows a split sample breakdown of respondents' trust in the counting of ballots by hand. The breakdown is as follows:
- Total
- Very high: 70%
- Somewhat high: 24%
- Somewhat low: 1%
- Very low: 2%
- Don't know: 2%
In total, 94% trust the accuracy of the election results, knowing that ballots are counted by hand.
The following subgroups were more likely to have a very high level of trust in the accuracy of the election results:[9]
- Those who reside in the Toronto Centre riding (80% versus 62% of those who reside in the York Centre riding).
- Electors who completed university (76% versus 67% with some post-secondary or who graduated college and 55% of those with high school or less education).
- Electors who were aware of the by-election (72% versus 61% of those unaware).
- Those who felt informed about the by-election (74% versus 57% of those who did not).
- Those who voted in the 2019 federal general election (74% versus 57% of non-voters).
Footnotes
[1] The official turnout rate was 25.6% in York Centre and 30.9% in Toronto Centre. There is often a discrepancy between the official turnout rate and the self-reported rate in post-election surveys. Two factors may be responsible for the over-representation of voters: 1) people who vote may be more likely than non-voters to participate in a study about voting (response bias); and 2) people who did not vote may report doing so because they think to present themselves in a more positive light (social desirability bias).
[2] This test was also included in the survey conducted following the by-elections held on February 25, 2019, and on May 6, 2019. These current results are consistent with those of the previous by-election surveys.
[3] Subgroup reporting is based on the aggregate variable, a computed variable that merges the split samples.
[4] The proportion of electors voting at an advance polling station is significantly higher than what is typically reported in by-election surveys. This may be the result of the pandemic.
[5] By-election surveys were conducted following by-elections held on October 23, 2017; December 11, 2017; June 18, 2018; December 3, 2018; February 25, 2019; and May 6, 2019.
[6] This test was included in the by-election surveys conducted following by-elections held on December 3, 2018, February 25, 2019, and May 6, 2019.
[7] When administered following the May 6, 2019, by-election, fewer respondents who were asked the general formulation reported that Elections Canada runs elections very fairly compared to those who were asked the specific formulation. This was the first and so far only time that this effect has been evident.
[8] This test was included in the by-election surveys conducted following by-elections held on December 3, 2018, February 25, 2019, and May 6, 2019.
[9] Subgroup reporting is based on the aggregate variable, a computed variable that merges the split samples.