 Site Menu
Survey of Electors Following the December 11, 2017, By-election in BonavistaBurinTrinity (Newfoundland and Labrador), ScarboroughAgincourt (Ontario), BattlefordsLloydminster (Saskatchewan) and South SurreyWhite Rock (British Columbia)
Detailed Findings
I. Awareness of the By-election and Voter Information
Widespread awareness of December 11, 2017, federal by-election
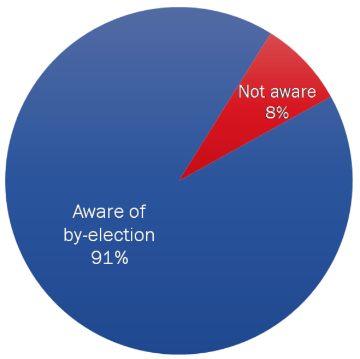
Nine in ten (91%) respondents said they were aware that a federal by-election took place on December 11, 2017, in their riding.
Figure 1: Awareness of By-election
Text description of "Awareness of By-election"
Q1: Did you know that a federal by-election took place on December 11, 2017, in your riding? Base: n=1,600; all respondents [Dk/nr: 1%]
Awareness of the by-election was higher among:
- residents of South SurreyWhite Rock (96%) compared to residents of ScarboroughAgincourt (88%), BattlefordsLloydminster (88%) and BonavistaBurinTrinity (91%);
- respondents who voted in the 2015 federal election (96% versus 66% of those who did not vote);
- those with some post-secondary and college education (93%) and university graduates (94%) compared to electors with a high school or less education (85%); and
- those 35 years of age and older (92% of those 3554 years of age, and 94% of those 55 years of age and older) compared to electors 1824 years of age at 73%.
Moderate recall of Elections Canada advertising
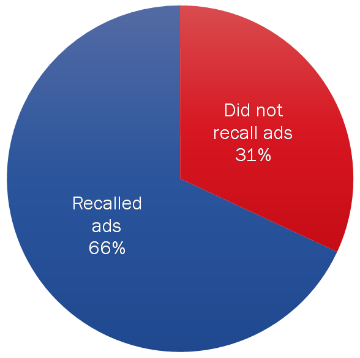
Two thirds (66%) of those who were aware of the by-election recalled seeing, hearing or reading advertisements or communications from Elections Canada about where and when to vote for the December 11, 2017, federal by-election.
Figure 2: Recall of Elections Canada Advertisements
Text description of "Recall of Elections Canada Advertisements"
Q29. During the election period, did you see, hear or read any advertising or communications from Elections Canada about how, when and where to vote in the by-election on December 11? Base: n=1,486; those aware of the by-election [Dk/nr: 3%]
Recall was higher among the following:
- residents of South SurreyWhite Rock (71%) compared to residents of BattlefordsLloydminster (60%);footnote 1
- those who voted in the by-election (73%) compared to those who did not vote (55%);
- those who received their VIC (68%) compared to those who did not (50%);
- those who voted in the 2015 federal election (67%) compared to those who did not (52%); and
- those who are retired (70%) compared to those who are employed (63%).
Traditional media and Elections Canada materials were main sources of recall
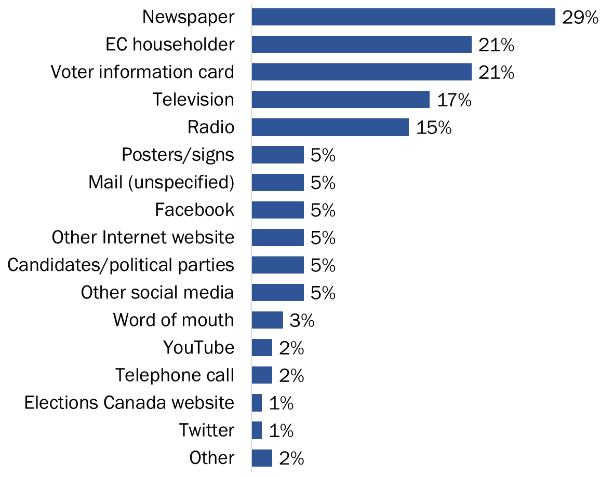
Those who recalled seeing, hearing or reading advertising or communications from Elections Canada for the December 11, 2017, federal by-election were most likely to have noticed it in a newspaper (29%), followed by an Elections Canada householder (21%), VIC (21%), television (17%), and radio (15%).
Figure 3: Source of Recall of Elections Canada Advertising
Text description of "Source of Recall of Elections Canada Advertising"
Q29a: Where did you see, hear or read about it? Base: n=1,004; respondents who recalled communications from EC [Dk/nr: 2%]. (Multiple responses accepted.)
Notable subgroup differences include the following:
- those who are 55 years of age or older were more likely to recall communications through a newspaper (37%) than those 2534 years of age (14%) and 3554 years of age (24%);
- residents in the South SurreyWhite Rock (48%) and BattlefordsLloydminster (37%) ridings were more likely to mention a newspaper than residents of the BonavistaBurinTrinity (13%) and ScarboroughAgincourt (16%) ridings;
- the likelihood of mentioning the Elections Canada householder was higher among residents of ScarboroughAgincourt (30%) compared to BattlefordsLloydminster (16%) and South SurreyWhite Rock (15%);
- residents of the BattlefordsLloydminster riding (25%) were more likely to mention radio than residents of the BonavistaBurinTrinity (16%), South SurreyWhite Rock (11%), and Scarborough-Agincourt (8%) ridings; and
- women were more likely to recall communications through a VIC than men (24% versus 17%).
Electors felt informed about how, when and where to vote
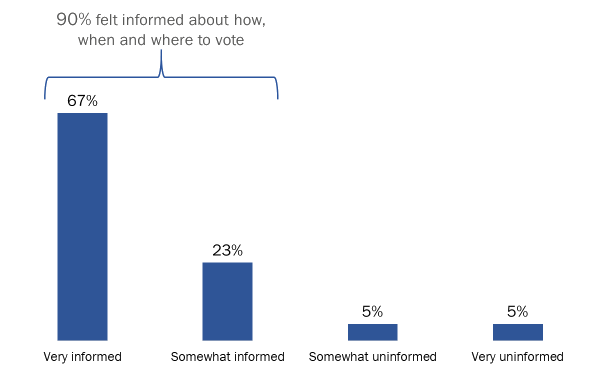
Nine in ten (90%) respondents felt informed about how, when and where to vote for the December 11, 2017, federal by-election, with 67% saying they felt very informed.
Figure 4: Knowledge of How, When and Where to Vote
Text description of "Knowledge of How, When and Where to Vote"
Q28. Overall, how well informed do you feel you were about how, when and where to vote? Base: n=1,486; those aware of the by-election [Dk/nr: <0.5%]
Respondents in the following subgroups were more likely to feel informed about how, when, and where to vote:
- residents of the South SurreyWhite Rock riding were more likely to feel informed about the election than residents of the other ridings (95% compared to 83% of residents of BattlefordsLloydminster, 88% of residents of BonavistaBurinTrinity, and 89% of residents of ScarboroughAgincourt);
- the likelihood of feeling informed was higher among electors 55 years of age and older (93%) compared to those 3554 years of age (87%) and those 1824 years of age (70%);
- electors who graduated university (92%) were more likely to feel informed than those who completed a high school or less education (87%);
- those who received a VIC (94%) compared to those who did not (53%);
- those who voted in the by-election (97%) compared to those who did not (77%);
- those who voted in the 2015 federal election (91%) compared to those who did not (70%);
- those who have a high level of trust in the election outcome (91%) compared to those who have a low level of trust (65%) and those who did not know about the trustworthiness of the election outcome (71%); and
- those who felt the election was run fairly (92%) compared to those who felt it was run unfairly (70%) and those who did not know about the fairness of the election (70%).
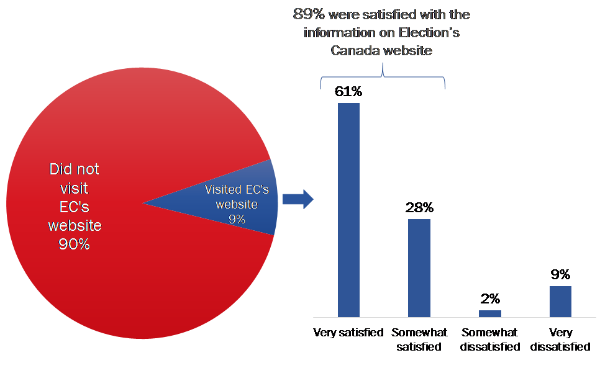
Few used Elections Canada's website, but those who did were satisfied with the information
One in ten (9%) electors who were aware of the by-election visited Elections Canada's website during the campaign. The likelihood of visiting the website was higher among university graduates (11%) than those with a high school or less education (6%).
Of the 112 respondents who visited Elections Canada's website during the campaign, 89% said they were satisfied with the information provided on the website, with 61% saying they were very satisfied.
Figure 5: Elections Canada Website
Text description of "Elections Canada Website"
Q30 [left]. Did you visit Elections Canada's website during the campaign? Base: n=1,486; those aware of the by-election [Dk/nr: 1%]
Q31 [right]. Overall, how satisfied were you with the information on Elections Canada's website? Would you say...? Base: n=112; all who visited the site
Electors under 35 years of age were more likely to be satisfied with the information than electors over 35 years of age (100% of electors under 35 years of age, 78% of electors 3554 years of age, and 92% of electors 55 years of age or older).
There were no significant differences between respondents from the four ridings.
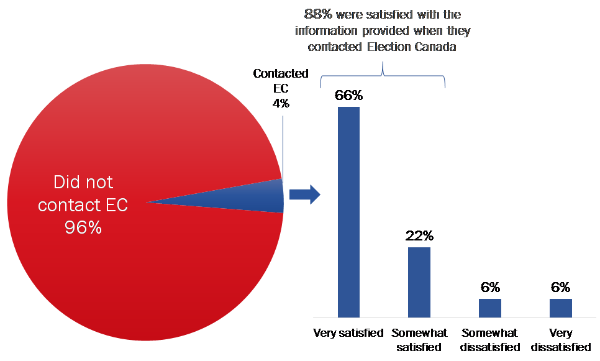
Few contacted Elections Canada, but those who did were satisfied with the information
Four percent of electors who were aware of the by-election said they contacted Elections Canada during the campaign.
Figure 6: Contact with Elections Canada
Text description of "Contact with Elections Canada"
Q32 [left]. Did you contact Elections Canada during the campaign? Base: n=1,486; those aware of the by-election
Q33 [right]. Overall, how satisfied were you with the information provided when you contacted Elections Canada? Would you say...? Base: n=61; respondents who contacted Elections Canada
The likelihood of contacting Elections Canada was higher among those who did not receive a VIC (13%) compared to those who did (3%).
There were no significant differences between respondents from the four ridings.
The vast majority (88%) of those who contacted Elections Canada (n=61) were satisfied with the information received from Elections Canada, with two thirds (66%) saying they were very satisfied.
There were no significant differences between respondents from the four ridings.
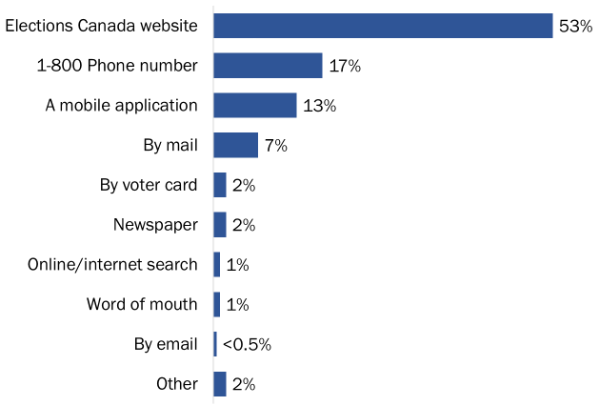
Elections Canada's website is the preferred source of information about voting in future elections
All electors were asked to choose which method they would prefer to use if they had to look for information about where, when and how to vote in a future election. Over half (53%) chose Elections Canada's website. Following this, 17% would prefer the 1-800 phone number, while 13% would prefer having a mobile application for their smartphone or tablet. This question was included to gauge interest among electors in using a mobile application to obtain information about voting.
Figure 7: Preferred Method for Gathering Information About Future Elections
Text description of "Preferred Method for Gathering Information About Future Elections"
Q38: If you had to look for information about where, when and how to vote in a future election, what would be your preferred method? Base: n=1,486; those aware of the by-election [Dk/nr: 2%]
Notable subgroup differences include the following:
- residents in South SurreyWhite Rock were more likely to say they would prefer to turn to Elections Canada's website than those in other ridings (63% compared to 54% of residents in BonavistaBurinTrinity, 49% in ScarboroughAgincourt, and 45% in BattlefordsLloydminster ridings);
- residents in the BonavistaBurinTrinity riding were more likely (23%) to prefer the 1-800 Election Canada phone number than residents of BattlefordsLloydminster (14%) and South SurreyWhite Rock (12%); and
- residents of BattlefordsLloydminster were more likely to prefer a mobile application than those in other ridings (23% compared to 12% in ScarboroughAgincourt, 10% in BonavistaBurinTrinity, and 6% in South SurreyWhite Rock).
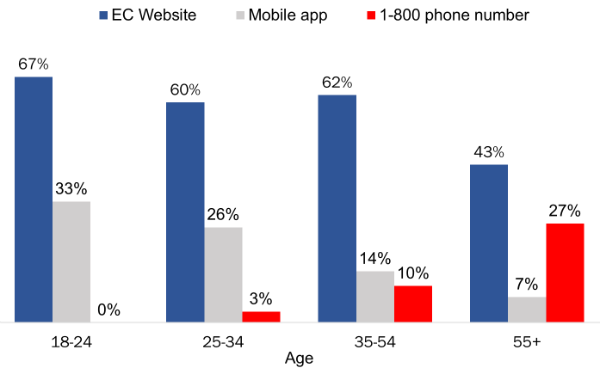
While all age groups would prefer the Elections Canada website over other methods, younger electors aware of the by-election were more likely to favour using a mobile application, while older respondents were more likely to favour using a toll-free number to obtain information about voting in future elections.
- The likelihood of preferring to use the Elections Canada website was lower among those 55 years of age or older (43%) compared to those 1824 years of age (67%), 2534 years of age (60%), and 3554 years of age (62%).
- Additionally, the likelihood of preferring to use a mobile application was lower among electors 55 years of age or older (7%) compared to those 1834 years of age (28%), and 3554 years of age (14%).
- The likelihood of preferring to use the 1-800 Elections Canada phone number increased with age, from 3% of those 2534 years of age, to 10% of those 3554 years of age, to 27% of those 55 years of age or older. No 1824 years of age elector expressed a preference for using the toll-free phone number.
Figure 8: Preferred Method for Gathering Information About Future Elections by Age
Text description of "Preferred Method for Gathering Information About Future Elections by Age"
Q38: If you had to look for information about where, when and how to vote in a future election, what would be your preferred method? Base: n=1,486; those aware of the by-election [Dk/nr: 2%]
II. Voter Information Card and Registration
The vast majority received a VIC
Nearly nine in ten (87%) electors who were aware of the by-election said they received their VIC.
Figure 9: Receipt of Voter Information Card
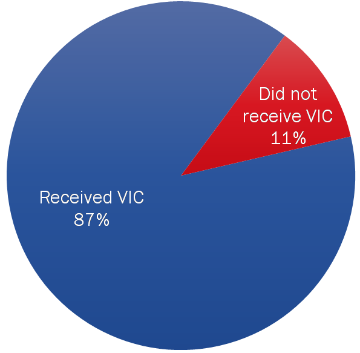
Text description of "Receipt of Voter Information Card"
Q4. During the campaign, did you receive a voter information card addressed to you personally and telling you where and when to vote? Base: n=1,486; those who said they were aware of the by-election [Dk/nr: 2%]footnote 2
The likelihood of receiving a VIC was higher among:
- residents of the South SurreyWhite Rock (94%) and ScarboroughAgincourt ridings (89%) compared to the BattlefordsLloydminster (83%) and BonavistaBurinTrinity (83%) ridings;
- electors 35 years of age or older (90% of those 3554 years of age, and 90% of those 55 years of age or older compared to 54% of those 1824 years of age and 78% of those 2534 years of age);
- university graduates (91%) compared to electors with a high school or less education (82%);
- electors who voted in the December 11, 2017, federal by-election (93%) compared to those who did not (79%); and
- electors who voted in the 2015 federal election (90%) compared to those who did not (69%).
Nearly all electors who received a VIC reported it had the correct name (98%) and address (99%).
Most brought their VIC to the Polling Station
Most (86%) electors brought their VIC when they went to vote.
Figure 10: Voter Information Card - Brought to Vote
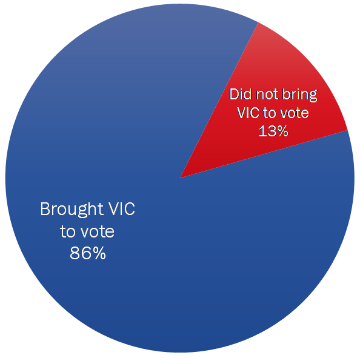
Text description of "Voter Information Card - Brought to Vote"
Q21. Did you bring your voter information card with you to the polling station/advance polling station/local Elections Canada office? Base: n=936; respondents who voted at an advance poll or at a polling station on election day [Dk/nr: 1%]
Residents of BonavistaBurinTrinity were less likely to bring their VIC to vote (71%) compared to residents of the other ridings (87% of electors from BattlefordsLloydminster, 90% from South SurreyWhite Rock, and 91% from ScarboroughAgincourt).
Electors know they need to be registered to vote
Approximately four in five (82%) respondents knew that electors need to be registered to vote in a Canadian federal election.
Figure 11: Awareness of Registration to Vote
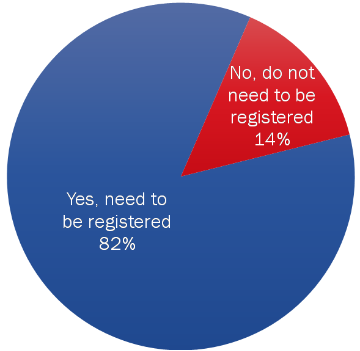
Text description of "Awareness of Registration to Vote"
Q7. To the best of your knowledge, do voters need to be registered in order to vote in a Canadian federal election? Base: n=1,600; all respondents [Dk/nr: 4%]
Residents of BonavistaBurinTrinity (86%) were more likely to know that voters need to be registered than residents of BattlefordsLloydminster (80%) and South SurreyWhite Rock (76%).
Most electors who did not receive a VIC did nothing about it
Over two thirds (71%) of electors who did not receive a VIC during the campaign did nothing to find out whether they were registered to vote in the federal by-election. Those who did something to find out if they were registered tended to find out at the polling station (8%) or by calling the 1-800 Elections Canada phone number (6%).
Figure 12: Steps Taken to Find Out If Registered to Vote
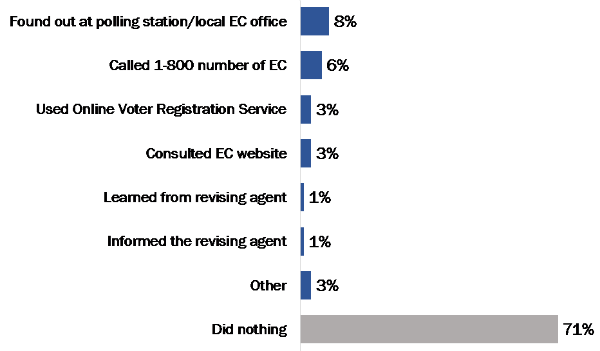
Text description of "Steps Taken to Find Out If Registered to Vote"
Q7A: What did you do to find out whether you were registered to vote in this by-election? Base: n=131; respondents who did not receive a VIC [Dk/nr: 7%]
The likelihood of doing nothing to find out if they were registered to vote was higher among:
- those 1824 years of age (92%) compared to those 55 years of age or older (62%); and
- those from BonavistaBurinTrinity (76%) compared to those from South SurreyWhite Rock (43%).
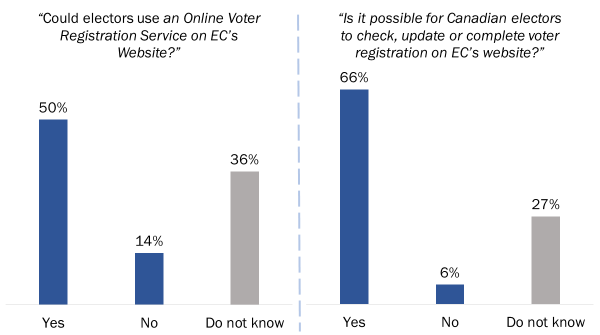
Most Canadians aware of Online Voter Registration Services
Awareness of online registration was tested using a split sample for a second time, the first time being the October 23,2017, By-election survey. Half the respondents (n=660) were asked if electors could use an "Online Voter Registration Service" on the Elections Canada website, a question previously used in post-electoral phone surveys. As this question had always yielded a high proportion of "don't know" answers, a simplified formulation was developed and asked to the other half of the sample (see full questions under the graph, below).
In both samples, most respondents were aware of online registration (50% and 66%, respectively). However, the second formulation led to a higher proportion of respondents who said yes, and a lower proportion of respondents who either said no or who did not know.
Figure 13: Awareness of Online Voter Registration
Text description of "Awareness of Online Voter Registration"
Q8A. To the best of your knowledge, could electors use an Online Voter Registration Service on Elections Canada's website to check, update or complete their voter registration during the last by-election? Base: n=660 respondents who know voters need to be registered.
Q8B. To the best of your knowledge, is it possible for Canadian electors to check, update or complete their voter registration on Elections Canada's website? Base: n=662 respondents who know voters need to be registered.
*SPLIT SAMPLE
The results of this second split sample experiment confirm that the second formulation of the question is easier to understand, as it resulted in a smaller proportion of respondents who indicated they did not know.
III. Voting and Voter Participation
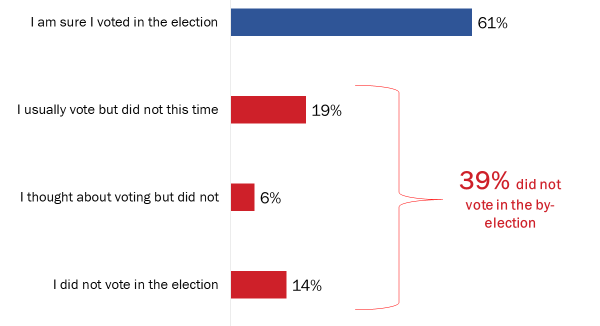
Most electors reported voting in the December 11, 2017, federal by-election
Three in five (61%) electors who were aware of the by-election stated they voted in the election.
Figure 14: Voter Participation in December 11, 2017, By-election
Text description of "Voter Participation in December 11, 2017, By-election"
Q2. Which of the following statements describes you? Base: n=1,486; those who said they were aware of the by-election [Dk/nr: <0.5%]
Significant subgroup differences include:
- residents of South SurreyWhite Rock (80%) were more likely to say that they voted in the election compared to other ridings: ScarboroughAgincourt (66%), BattlefordsLloydminster (51%) and BonavistaBurinTrinity (47%);
- the likelihood of voting was higher among those who voted in the 2015 federal election (67%) compared to 12% of those who did not;
- the likelihood of voting was higher among those who received a VIC (65%) compared to 35% who did not; and
- furthermore, the likelihood of voting increased with age (from 41% of electors 1824 years of age to 69% of electors 55 years of age or older) and education (from 52% of high school educated electors to 70% of university graduates).
Everyday Life and Health are Main Reasons for Not Voting in the Election
Of the 529 respondents who said they did not vote during the election, nearly half (47%) said they did not vote due to everyday life and health reasons. Following this, respondents reported they did not vote due to political reasons (26%) and electoral process-related reasons (12%).
Figure 15: Main Reasons for Not Voting Themes

Text description of "Main Reasons for Not Voting Themes"
Q3: What is the main reason you did not vote? Base: n=529; respondents who did not vote [Dk/nr: 3%]
The table below provides a breakdown of all the reasons why respondents did not vote during the December 11, 2017, federal by-election.
Figure 16: Main Reasons for Not Voting Breakdown
| Reasons for Not Voting | % |
|---|---|
| Everyday life or health reasons | 47% |
| Too busy | 28% |
| Out of town | 12% |
| Illness or disability | 8% |
| Political reasons | 26% |
| Not interested in politics | 9% |
| Felt voting would not make a difference | 5% |
| Lack of information about campaign issues and parties' positions | 4% |
| Did not like candidates/parties/campaign | 4% |
| Did not know who to vote for | 4% |
| Electoral processrelated reasons | 12% |
| Lack of information about voting process (e.g. when/where to vote) | 4% |
| Transportation problem/polling station too far | 4% |
| Issues with the voter information card | 2% |
| Not on voters list | 1% |
| Could not prove identity or address | 1% |
| Other reasons | 13% |
| Forgot to vote | 10% |
| Religious or other beliefs | Less than 0.5% |
| Other | 3% |
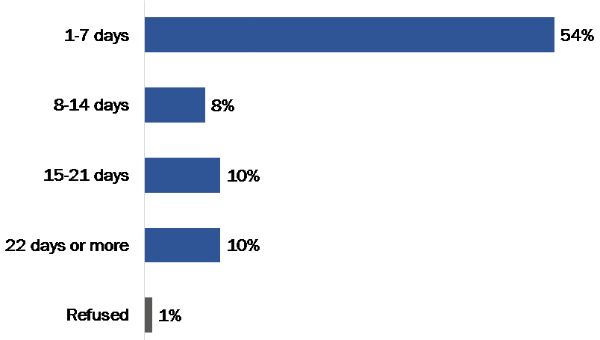
Additionally, of the 64 respondents who did not vote because they were out of town, 54% reported they were out of town for a week or less and 28% reported being out of town for longer than a week.
Figure 17: Out-of-Town Non-Voters Length of Time Away From Home
Text description of "Out-of-Town Non-Voters Length of Time Away From Home"
Q3b: How long were you away from home? Base: n=64; respondents who were away from home during the election [Dk: 17%]
These results suggest that a number of electors who were unable to vote due to being out of town on election day might have availed themselves of early voting options, such as advance polls, voting at a local Elections Canada office or voting by mail. Due to the relatively high proportion of respondents who declined to answer (1% refused and 17% did not know how long they were away from home), the exact proportions in the graph should be treated with caution.
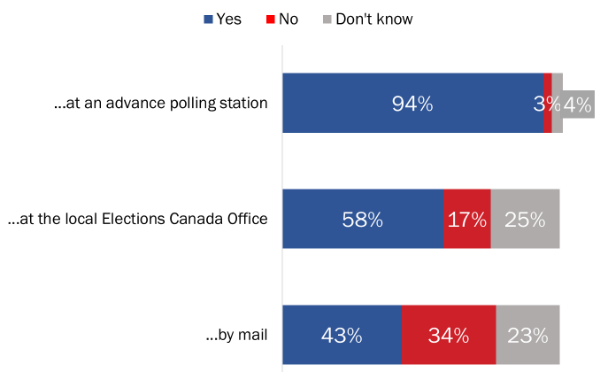
Electors are aware of various voting methods
Nearly all respondents (94%) said they were aware that electors could vote at advance polling stations. Following this, 58% said that it is possible to vote at the local Elections Canada office and 43% said that electors can vote by mail.
Figure 18: Knowledge of Voting Methods
Text description of "Knowledge of Voting Methods"
Q9A. At federal elections, is it possible for Canadian electors to vote ... at the advance polling station? Base: n=1,600.
Q9B. At federal elections, is it possible for Canadian electors to vote ... at the local Elections Canada office? Base: n=1,600.
Q9C. At federal elections, is it possible for Canadian electors to vote ... by mail? Base: n=1,600.
Respondents who were aware they can vote at an advance polling station were:
- more likely to be residents of South SurreyWhite Rock (96%) than residents of BattlefordsLloydminster (91%); and
- more likely to be college (96%) or university (95%) educated than high school educated (89%).
Respondents who were aware they can vote at a local Elections Canada office were more likely to be 55 years of age or older (64%) compared to 3554 years of age (50%).
Respondents who were aware they can vote through mail were:
- more likely to be residents of BattlefordsLloydminster (47%) than BonavistaBurinTrinity (39%); and
- more likely to be between 2534 years of age (66%) than 1824 years of age (40%), 3554 years of age (46%), or 55 years of age or older (36%).
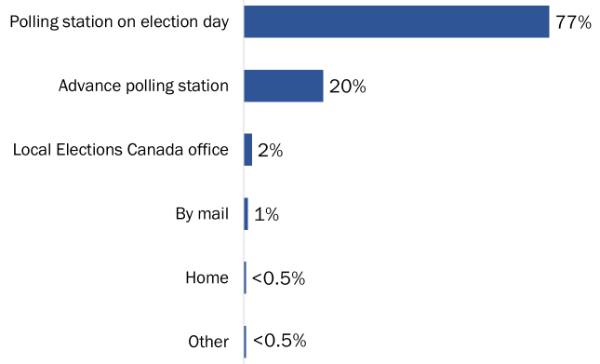
Majority of electors opted to vote at polling station on Election Day
Over three quarters (77%) of electors stated they voted at a polling station on election day. Additionally, one in five said they used advance polling stations, 2% said they voted at an Elections Canada office, and 1% said they voted by mail.
Figure 19: Methods Used to Vote
Text description of "Methods Used to Vote"
Q10A: Which method did you use to vote? Was it... Base: n=951; all respondents who voted [Dk/nr: <0.5%]
Respondents who voted on election day were more likely to:
- be residents of BonavistaBurinTrinity (85%) than residents of ScarboroughAgincourt (73%) and South SurreyWhite Rock (74%); and
- be high school educated (86%) than university graduates (72%).
Respondents who voted at an advance polling station were more likely to:
- be residents of South SurreyWhite Rock (25%) and ScarboroughAgincourt (23%) than residents of BonavistaBurinTrinity (10%); and
- be university graduates (26%) than high school (11%) and college (17%) educated.
Electors voted at an advance poll and Elections Canada office due to convenience
Of the respondents who voted at an advance poll or at the local Elections Canada office, the largest proportion did so because it was convenient (56%). Following this, 21% did so because they knew they would be out of town and 19% did so because they would be busy on election day.
Figure 20: Reasons to Vote at Advance Polling Station or Elections Canada Office

Text description of "Reasons to Vote at Advance Polling Station or Elections Canada Office"
Q10B: Is there a specific reason as to why you used the option to vote? Base: n=195; respondents who voted at advance polling station or EC office [Dk/nr: 5%]
IV. Voter Identification
Widespread awareness of identification requirements
Using a split sample, awareness of identification requirements was tested. Traditionally, post-electoral surveys asked respondents whether or not they needed a proof of identity first, and a proof of address second. This formulation led to very high proportions of "yes" for both questions, but survey pre-tests seemed to indicate that some respondents did not perceive a difference between the two (i.e. between proof of address and proof of identity). Thus, a second version of this question was developed, asking respondents whether, to the best of their knowledge, electors need proof of identity, proof of address, both, or none. The two formulations were compared using the aforementioned split sample experiment.
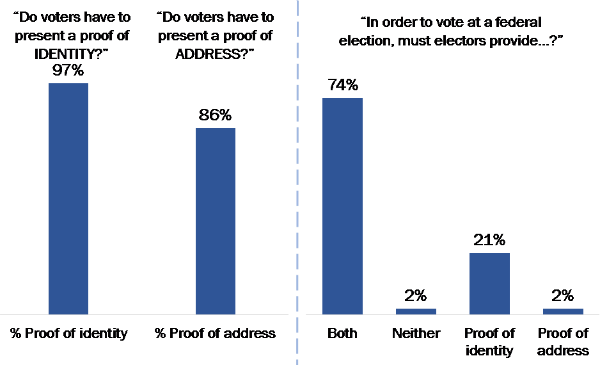
Comparable to previous surveys, the first formulation found that nearly all (97%) respondents think that electors have to present proof of identity to vote in a Canadian election. Most respondents (86%) also said electors have to present a proof of address.
Of those asked in the second formulation, three quarters (74%) correctly identified that both proof of identity and address are required to vote in a Canadian federal election. In contrast, one quarter (25%) answered incorrectly: 21% of respondents said only proof of identity is needed, 2% said only proof of address is needed, and 2% said neither is needed to vote.
Figure 21: Awareness of Voter Identification Requirements
Text description of "Awareness of Voter Identification Requirements"
Q12B [left]. Do voters have to present a proof of IDENTITY in order to vote in a Canadian federal election? Split sample: n=799. [DK/NR: 1%]
Q13 [left]. Do voters have to present a proof of ADDRESS in order to vote in a Canadian federal election? Split sample: n=799. [DK/NR: 4%]
Q12A [right]. In order to vote in a Canadian federal election, must electors provide...? Split sample: n=801. [DK/NR: 1%]
These results are similar to those obtained in the October 23, 2017, By-election survey. Together, they suggest that the new formulation leads to results that better reflect respondents' grasp of identification requirements.
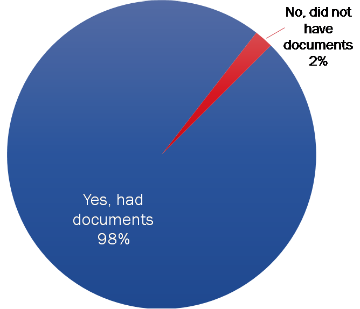
Almost all who voted had the required identification
Ninety-eight percent of those who voted using the advance poll or at the polling station on election day had the required identification.
Figure 22: Identification Requirement
Text description of "Identification Requirement"
Q14. Did you have the required identification documents with you? Base: n=926; respondents who voted at an advance poll or at a polling station on election day. [Dk/nr: <0.5%]
Significant subgroup differences include the following:
- residents of BonavistaBurinTrinity were least likely to have the required identification (93%) compared to residents of ScarboroughAgincourt (98%), residents of BattlefordsLloydminster (99%), and residents of South SurreyWhite Rock (100%); and
- respondents under 35 years of age were more likely to have the required identification documents than those 55 years of age or older (100% versus 97% respectively).
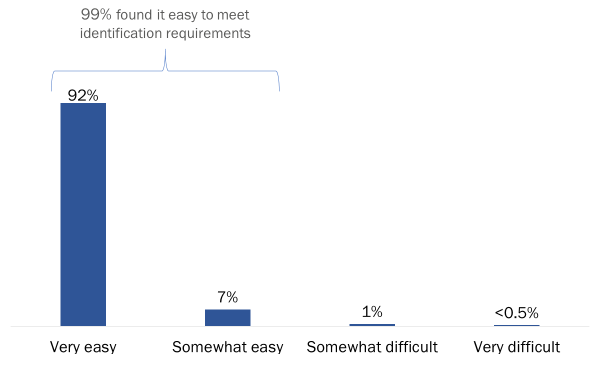
Virtually all voters found it easy to meet the identification requirement
Ninety-nine percent of voters found it easy to meet the identification requirements, with 92% saying it was very easy.
Figure 23: Ease of Meeting Voter Identification Requirements
Text description of "Ease of Meeting Voter Identification Requirements"
Q15. Overall, how easy was it to meet the identification requirements? Would you say that it was...? Base: n=926; respondents who voted at an advance poll or at a polling station on election day.
V. Voter Experience
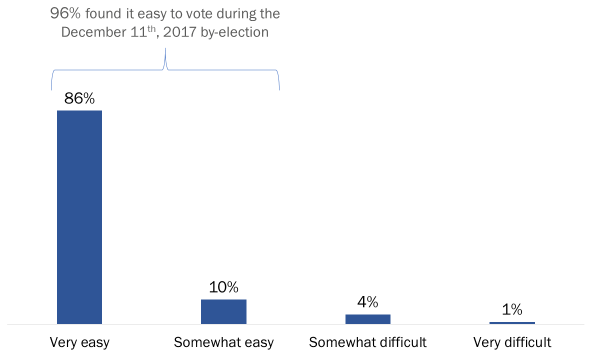
Virtually all voters found it easy to vote
Of the respondents who voted during the December 11, 2017, federal by-election, 96% claimed it was easy to vote, with 86% saying it was very easy.
Figure 24: Ease of Voting
Text description of " Ease of Voting"
Q11. Overall, how easy was it to vote? Would you say it was...? Base: n=948; respondents who voted and identified a voting method. [Dk/nr: <0.5%]
The likelihood of finding it easy to vote was higher among:
- respondents between 1824 years of age (100%) and 2534 years of age (100%) than those 3554 years of age (95%) and 55 years of age or older (95%); and
- those who voted in the 2015 federal election (96%) compared to those who did not (72%).
There were no significant differences between respondents from the four ridings.
Vast majority went to polling station from home
Of those who voted in person for the December 11, 2017, federal by-election, the vast majority (87%) said they went to the polling station from home.
Figure 25: Voting Facilities [Starting Location]
![> Figure 25: Voting Facilities [Starting Location]](/res/rec/eval/bydec2017_b/images/fig25_e.png)
Text description of "Voting Facilities [Starting Location]"
Q16. When you went to vote, did you go to the polling station from home, from work or from another location? Base: n=936; respondents who voted at an advance poll, polling station on election day or local Elections Canada office. [Dk/nr: 1%]
Notable subgroup differences include the following:
- residents of ScarboroughAgincourt (93%) were more likely to go to the polling station from home than residents of BattlefordsLloydminster (81%); and
- respondents 55 years of age or older (92%) were more likely to go to the polling station from their home than electors 3554 years of age (78%).
Location of the polling station convenient and easy to reach
There was virtual unanimity among those who voted in person that the location was a convenient distance from home (96%) and that it was not difficult to reach the voting location (97%).
Figure 26: Voting Facilities [Distance and Ease of Access]
![Figure 26: Voting Facilities [Distance and Ease of Access]](/res/rec/eval/bydec2017_b/images/fig26_e.png)
Text description of "Voting Facilities [Distance and Ease of Access]"
Q17 [left]. Was the polling station/advance poll/Elections Canada office at a convenient distance from your home? Base: n=936; respondents who voted at an advance poll, polling station on election day or local Elections Canada office. [Dk/nr: <0.5%]
Q18A [right]. Did you have any difficulty reaching the polling station/advance poll/Elections Canada office? Base: n=936; respondents who voted at an advance poll, polling station on election day or local Elections Canada office. [Dk/nr: <0.5%]
There were no significant differences between respondents from the four ridings when asked whether the voting location was a convenient distance from their home and no noteworthy differences when it came to reaching their voting location.
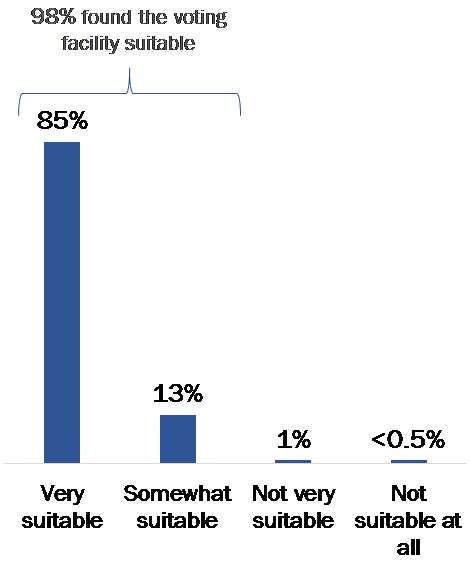
Nearly all agree that facilities were suitable and had enough signs
Almost all voters (98%) said the building where they voted was suitable, with 85% saying it was very suitable. Furthermore, 96% said that there were enough signs inside the facility to help them find where they should go to vote.
Figure 27: Voting Facilities [Suitability]
Text description of "Knowledge of Voting Methods"
Q19. Would you say that the building where you voted was...? Base: n=936; respondents who voted at an advance poll, polling station on election day or local Elections Canada office [Dk/nr: <0.5%]
There were no significant differences between respondents from the four ridings when asked about the suitability of the building where they voted.
Voters were most likely to vote during the evening
The largest proportion (43%) of all voters surveyed, n=936, stated they voted between 4 p.m. and after 9 p.m.
Of the voters who voted on election day (n=741), 28% reported going to vote in the afternoon between noon and 4 p.m., 39% claimed voting in the evening between 4 p.m. and closing of polls, and 27% in the morning from opening of polls until noon.
Figure 28: Time of Day Voted [Election Day]
![Figure 28: Time of Day Voted [Election Day]](/res/rec/eval/bydec2017_b/images/fig28_e.png)
Text description of "Time of Day Voted [Election Day]"
Q22. Do you remember approximately what time it was when you went to vote? Base: n=741; respondents who voted at a polling station on election day [Dk/nr: 8%]
*Election day polls hours: Bonavista-Burin-Trinity (NL) 8:30 am. to 8:30 p.m.; Scarborough-Agincourt (ON) 9:30 a.m. to 9:30 p.m.; Battlefords-Lloydminster (SK) 8:30 a.m. to 7:30 p.m. and; South Surrey-White Rock (BC) 7 a.m. to 7 p.m.
More than half (58%) of those who voted at an advance polling stationfootnote 3 (n=183) on December 1 to December 4, 2017, reported going to vote between noon and 4 p.m.
Figure 29: Time of Day Voted [Advance Polling]
![Figure 29: Time of Day Voted [Advance Polling]](/res/rec/eval/bydec2017_b/images/fig29_e.png)
Text description of "Time of Day Voted [Advance Polling]"
Q22. Do you remember approximately what time it was when you went to vote? Base: n=183; respondents who voted at an advance poll [Dk/nr: 10%]
*Advance polling stations were open from 12 p.m. to 8 p.m. from December 1st to 4th, 2017.
Most voters took five minutes or less to vote
Sixty-five percent of all voters surveyed said voting took them five minutes or less.
Figure 30: Length of Time to Vote [ALL]
![Figure 30: Length of Time to Vote [ALL]](/res/rec/eval/bydec2017_b/images/fig30_e.png)
Text description of "Length of Time to Vote [ALL]"
Q23. To the best of your knowledge, how long did it take you to vote at the polling station/advance polling station/local Elections Canada office? This does not include travel time. Base: n=936; respondents who voted at an advance poll, polling station on election day or local Elections Canada office [Dk/nr: 1%]
Among those who voted on election day, 71% said it took them less than five minutes to vote. By comparison, only 41% of those who voted at an advance polling station said it took them less than five minutes to vote.
Figure 31: Length of Time to Vote [Election Day vs. Advance Polling Station]
![Figure 31: Length of Time to Vote [Election Day vs. Advance Polling Station]](/res/rec/eval/bydec2017_b/images/fig31_e.png)
Text description of " Length of Time to Vote [Election Day vs. Advance Polling Station]"
Q23. How long did it take you to vote at the polling station? This does not include travel time. Base: n=741; respondents who voted at a polling station on election day [Dk/nr: <0.5%]
Q23. How long did it take you to vote at the advance polling station? This does not include travel time. Base: n=183; respondents who voted at an advance poll [Dk/nr: 2%]
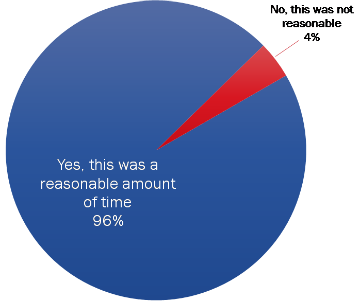
Nearly everyone was satisfied with the time required to vote
Ninety-six percent of those who voted felt that the time it took them to vote was reasonable.
Figure 32: Satisfaction With Time Taken to Vote
Text description of "Satisfaction With Time Taken to Vote"
Q24. Would you say that this was a reasonable amount of time? Base: n=936; respondents who voted at an advance poll or at a polling station on election day or local Elections Canada office [Dk/nr: <0.5%]
Significant subgroup differences include the following:
- residents of South SurreyWhite Rock (92%) were less likely than residents of BonavistaBurinTrinity (99%) and BattlefordsLloydminster (98%) to be satisfied with the amount of time taken to vote; and
- those 1824 years of age (100%) and 2534 years of age (100%) were more likely to be satisfied with the time taken to vote than those 55 years of age or older (96%).
Almost all voters were satisfied with Elections Canada staff
Ninety-eight percent of voters were satisfied with the Elections Canada staff, with 88% saying they were very satisfied.
Figure 33: Satisfaction With Elections Canada Staff

Text description of "Satisfaction With Elections Canada Staff"
Q27. Overall, how satisfied were you with the services provided by Elections Canada staff when you voted? Would you say...? Base: n=936; respondents who voted at an advance poll or at a polling station on election day or local Elections Canada office.
Ninety-nine percent of voters were satisfied with the service they received in their chosen official language when they voted.
Virtually all were satisfied with their voting experience
Ninety-seven percent of voters were satisfied with their overall voting experience during the December 11, 2017, federal by-election, with 82% saying they were very satisfied.
Figure 34: Satisfaction With Overall Voting Experience

Text description of "Satisfaction With Overall Voting Experience"
Q34. Overall, how satisfied were you with your voting experience? Would you say...? Base: n=951; all respondents who voted. [Dk/nr: <0.5%]
There were no significant differences in satisfaction between respondents from the four ridings.
VI. Fairness
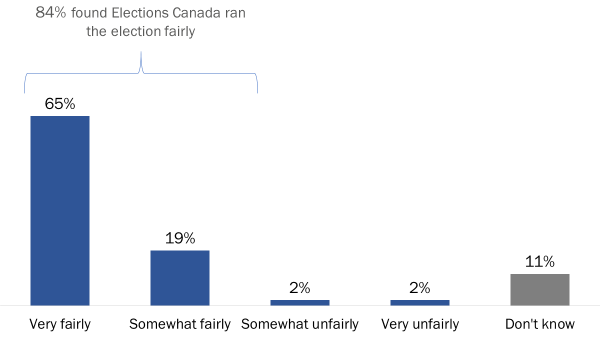
Majority perceive Elections Canada ran the December 11, 2017, federal by-election fairly
Over four in five (84%) electors who were aware of the December 11, 2017, federal by-election would say that Elections Canada ran the election fairly, with 65% saying the by-election ran very fairly.
Figure 35: Perceptions of Elections Canada's Fairness
Text description of "Perceptions of Elections Canada's Fairness"
Q35. Thinking about the December 11, 2017, federal by-election, would you say that Elections Canada ran the election...? Base: n=1,486; those aware of the by-election
The likelihood of saying the election was run fairly was higher among:
- residents of South SurreyWhite Rock (88%) compared to residents of BonavistaBurinTrinity (81%);
- those who voted in the by-election (92%) compared to those who did not (69%);
- those who voted in the 2015 federal election (86%) compared to those who did not (59%); and
- those who received a VIC (85%) compared to those who did not (74%).
In contrast, electors between 2534 years of age (72%) were less likely to say the by-election ran fairly than electors 55 years of age or older (88%).
Almost all trust the accuracy of by-election results
Nine in ten (90%) respondents who were aware of the by-election stated they have a high level of trust in the accuracy of the election results in their riding.
Figure 36: Trust in Accuracy of Results
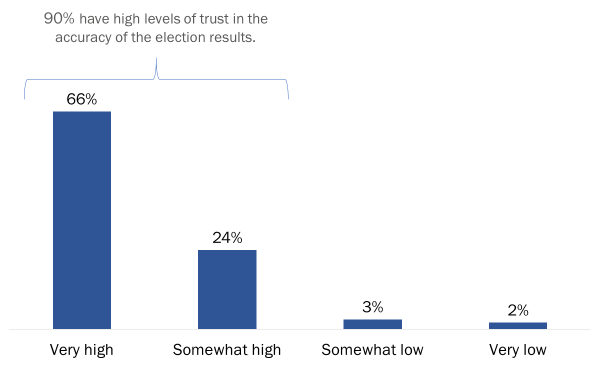
Text description of "Trust in Accuracy of Results"
Q36. What level of trust do you have in the accuracy of the election results in your riding? Is it...? Base: n=1,486; those aware of the by-election. [Dk/nr: 4%]
Notable subgroup differences include the following:
- residents of South SurreyWhite Rock (95%) were more likely to trust the accuracy of the results in their riding than residents of the ScarboroughAgincourt (86%) and BattlefordsLloydminster (90%) ridings;
- trust in the accuracy of the results was higher among university graduates (94%) than among electors with a high school or less education (86%);
- those who voted in the 2015 federal election (93%) were more likely to trust the accuracy of the results in their riding than those who did not (73%); and
- those who voted in the by-election (95%) were more likely to trust the accuracy of the results in their riding than those who did not (84%).
Main reason for low level of trust is concerns of voter turnout or a surprising result
Of the 82 respondents who had a low level of trust in the accuracy of the by-election results, 15% attributed the low level of trust to concerns with low turnout or a surprising outcome and to concerns with fairness or integrity, respectively. Additionally, 14% cited mistrust of government or politics, 12% cited not being aware or sufficiently informed of the by-election, and 11% cited dissatisfaction with electoral services as the reason for the low level of trust. Other reasons were cited by 9% of those who had a low level of trust in the election results, as demonstrated in the graph below.
Figure 37: Explanations for Low Level of Trust in Election Results
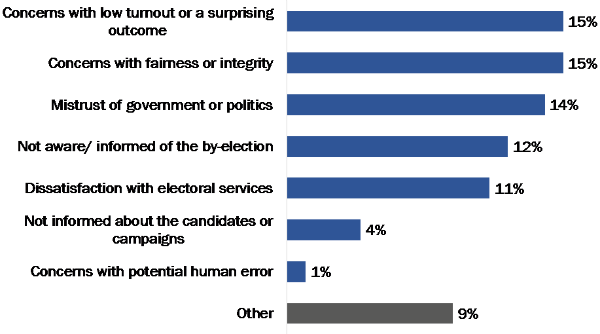
Text description of "Explanations for Low Level of Trust in Election Results."
Q37. Is there a specific reason as to why your level of trust is low when it comes to the accuracy of the election results in your riding? Base: n=82; those with low trust in accuracy of results. [Dk/nr: 22%]
Return to source of Footnote 1 In line with the way we report differences between subgroups (see Note to readers, on p. 2), we only report results for specific electoral districts when they are statistically significant from each other. If one or more electoral districts are not mentioned in a comparison of subgroup differences, it means that significant differences were found only among the categories reported.
Return to source of Footnote 2 This question was back-coded to include those who said they learned they were registered to vote from the VIC at Q7A.
Return to source of Footnote 3 Advance polling stations were open from noon to 8 p.m. on December 1 to December 4, 2017.