 Site Menu
Survey of Electors Following the April 3, 2017, By-elections in Calgary Heritage (Alberta), Calgary Midnapore (Alberta), Markham–Thornhill, (Ontario), Ottawa–Vanier (Ontario) and Saint-Laurent (Quebec)
V. Voter Experience
Ease of Voting
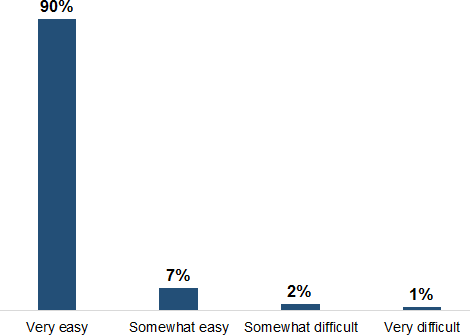
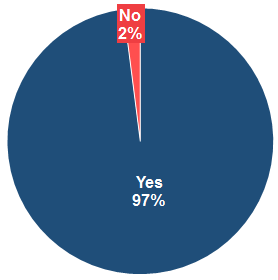
Almost all respondents who voted (97%) said that it was easy to vote, including 90% who found it very easy.
- Voters from the ridings of Saint-Laurent (83%) and Markham–Thornhill (86%) were less likely to say it was very easy to vote (vs. 92% to 96% of voters in the other ridings).
- English-speaking voters (93%) were more likely than Francophones (78%) to have said it was very easy to vote.
Text description of "Ease of Voting"
Q11. Overall, how easy was it to vote? Would you say it was
?
Base: n=1,309; respondents who voted and identified a voting method. Dk/nr: <1%
Voting Facilities—Distance and Ease of Access
Almost everyone who voted said that the polling centres were a convenient distance from their home.
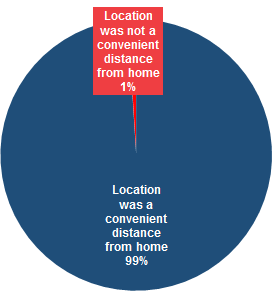
Q16. Was the polling station/advance poll/Elections Canada office at a convenient distance from your home?
Additionally, 98% of those who voted said they did not have any difficulty reaching a voting location.

Text description of "Voting Facilities—Distance and Ease of Access"
Q17. Did you have any difficulty reaching the polling station/advance poll/Elections Canada office?
Base: n=1,285; respondents who voted at an advance poll or at a polling station on election day
Voting Facilities—Difficulties Encountered
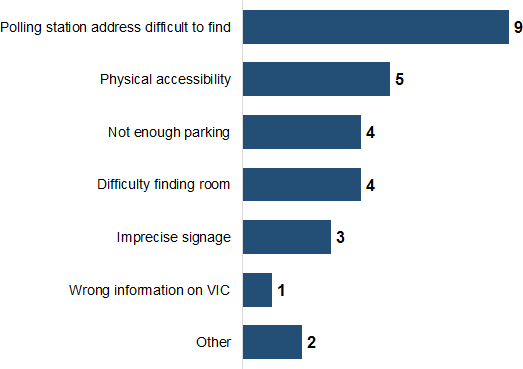
Of those who experienced difficulty reaching the polling centre (n=30), nine of these voters said the address of the polling station was difficult to find, five mentioned physical accessibility, and four each mentioned insufficient parking and difficulty finding the room inside the building.
- Exercise caution interpreting due to the small sample size.
- Results are presented as unweighted frequencies.
Text description of "Voting Facilities—Difficulties Encountered"
Q18: Could you briefly describe the main difficulty in reaching the polling station/advance polling station/local Elections Canada office?
Base: n=30; respondents who had difficulty reaching location. Dk/nr: 7 respondents
Voting Facilities—Suitability and Signage
Almost all voters (98%) said that the building where they voted was suitable, including 87% who said it was very suitable. Those from the ridings of Saint-Laurent (79%) and Calgary Midnapore (82%) were less likely to find them very suitable (vs. 89% to 95% of voters in the other ridings).
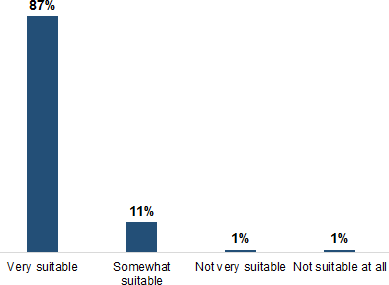
Q19. Would you say that the building where you voted was ?
The vast majority (97%) said that there were enough signs inside the facility to help them find where to go for voting. Compared to voters age 25 to 34 (100%), voters age 35 and older were less likely to say the signage was sufficient (96% of 35- to 54-year-olds and 97% of those age 55 and older).
Text description of "Voting Facilities—Suitability and Signage"
Q20. Once inside, were there enough signs to help you find where to go for voting?
Base: n=1,285; respondents who voted at an advance poll or at a polling station on election day. Dk/nr: <1%
Time of Day Voted—Advance Polling Day
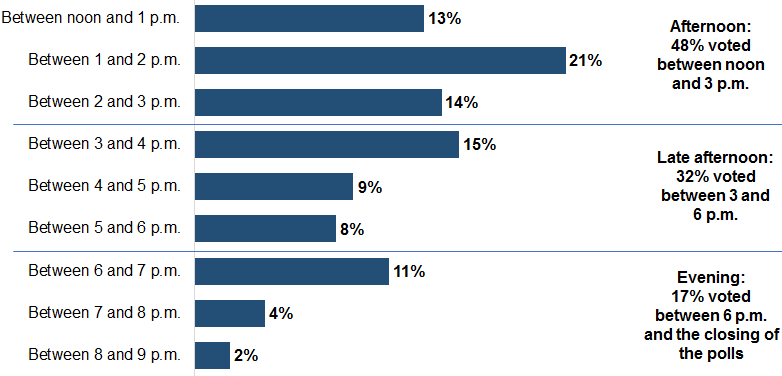
Text description of "Time of Day Voted—Advance Polling Day"
Q22. Do you remember approximately what time it was when you went to vote?
Base: n=238; respondents who voted at an advance polling station and provided a valid response. Dk/nr: 4%
Time of Day Voted*—Election Day
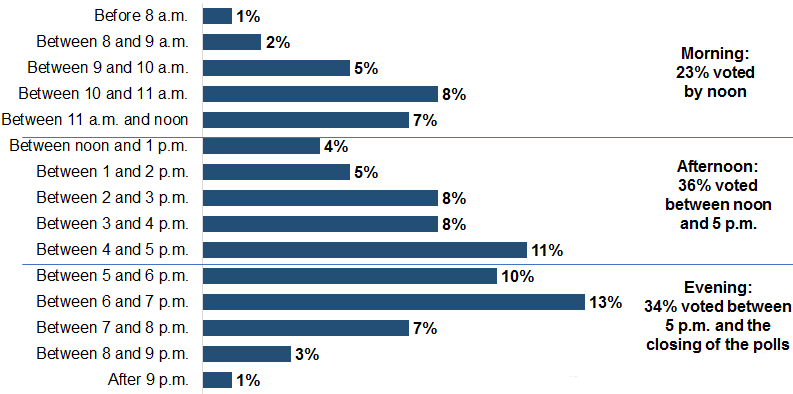
Text description of "Time of Day Voted*—Election Day"
Q22. Do you remember approximately what time it was when you went to vote?
Base: n=977; respondents who voted on election day. Dk/nr: 5%
*Note: Opening hours are staggered across the country on election day:
Newfoundland, Atlantic, Central 8:30 a.m.8:30 p.m.
Eastern 9:30 a.m.9:30 p.m.
Mountain 7:30 a.m.7:30 p.m.
Pacific 7:00 a.m.7:00 p.m.
Length of Time to Vote—Advance Polling Day
Exactly two thirds of those who voted at an advance polling station said it took them five minutes or less to vote. This includes 2% who said it took one minute, 13% two minutes, 8% three minutes, 1% four minutes, and 42% five minutes. An additional 18% said it took between six and 10 minutes. In total, therefore, 84% of voters took no more than 10 minutes to vote.
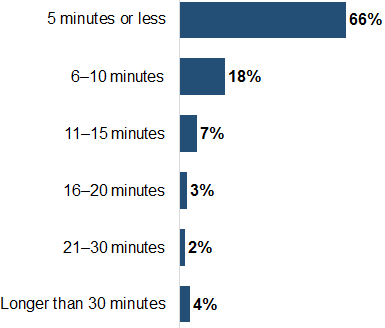
Text description of "Length of Time to Vote—Advance Polling Day"
Q23. How long did it take you to vote AT THE polling station/advance polling station/local Elections Canada office? This does not include travel time.
Base: n=278; respondents who voted at an advance polling station
Length of Time to Vote—Election Day
The majority of voters (74%) said it took them five minutes or less to vote. This includes 8% who said it took one minute, 14% two minutes, 9% three minutes, 4% four minutes, and 39% five minutes. An additional 18% said it took between six and 10 minutes. In total, therefore, 92% of voters took no more than 10 minutes to vote.
- Voters from the Calgary Midnapore riding (82%) were more likely than those from Saint-Laurent (66%) to say it took five minutes or less to vote.
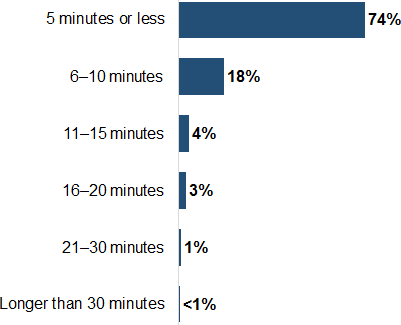
Text description of "Length of Time to Vote—Election Day"
Q23. How long did it take you to vote AT THE polling station/advance polling station/local Elections Canada office? This does not include travel time.
Base: n=977; respondents who voted at a polling station on election day. Dk/nr: 1%
Satisfaction with Time Taken to Vote
Almost everyone who voted (98%) felt that the time it took to do so was reasonable.
- Voters who said it took more than 10 minutes to vote were more likely to say this was not a reasonable amount of time.
Percentage who said they waited a reasonable amount of time
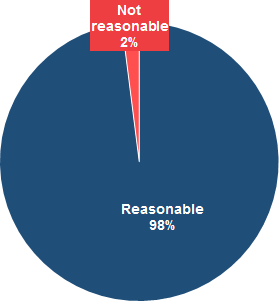
Text description of "Satisfaction with Time Taken to Vote"
Q24. Would you say that this was a reasonable amount of time?
Base: n=1,285; respondents who voted at an advance poll or at a polling station on election day. Dk/nr: 1%
Service in Official Languages
Most voters were served in English (83%). Thirteen percent were served in French and 3% were served in both official languages.
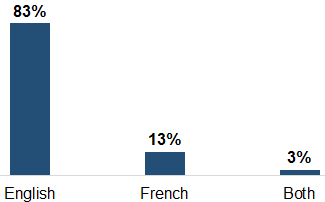
Q25. Voters can choose to be served in either official language, English or French. In which language were you served? Dk/nr: <1%
Almost all voters (99%) were satisfied with the official language in which they were served.
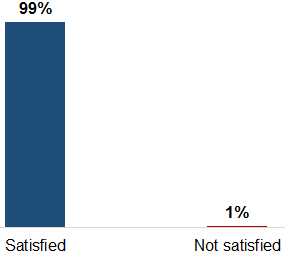
Text description of "Service in Official Languages"
Q26. Were you satisfied or not with the official language in which you were served?
Base: n=1,285; respondents who voted at an advance poll or at a polling station on election day
Satisfaction with Elections Canada Staff
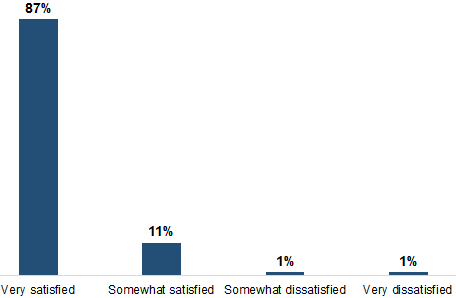
The vast majority of voters (98%) were satisfied with the services provided by Elections Canada staff. Fully 87% said they were very satisfied, while 11% said they were somewhat satisfied.
- Voters in the ridings of Calgary Heritage (94%) and Calgary Midnapore (92%) were more likely to be very satisfied than those who voted in the other ridings (81% to 85%).
- In addition, the following were more likely to say they were very satisfied with the services provided by Elections Canada staff: voters age 55 and older (90%), English- speaking voters (89%), and those who voted in the 2015 federal general election (89%).
Text description of "Satisfaction with Elections Canada Staff
"
Q27. Overall, how satisfied were you with the services provided by Elections Canada staff when you voted? Would you say...?
Base: n=1,285; respondents who voted at an advance poll or at a polling station on election day. Dk/nr: <1%
Satisfaction with Overall Voting Experience
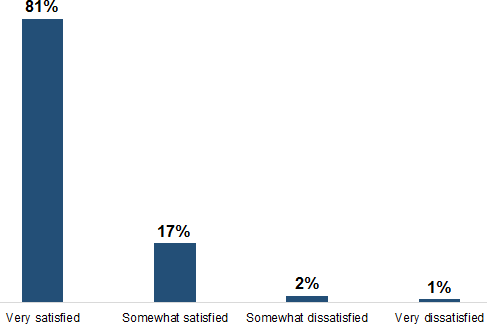
There was widespread overall satisfaction among those who voted in the by-election. Eighty-one percent were very satisfied with their experience and 17% were somewhat satisfied.
- Those from the riding of Saint-Laurent (69%) were less likely than voters from the other ridings to say they were very satisfied with their experience.
- Satisfaction was highest in the ridings of Calgary Heritage (88% were very satisfied) and Calgary Midnapore (88%).
- English-speaking electors (85%) were more likely to be very satisfied with their overall experience (vs. 68% of French-speakers and 73% of Allophones).
Text description of "Satisfaction with Overall Voting Experience"
Q34. Overall, how satisfied were you with your voting experience? Would you say
?
Base: n=1,312; all respondents who voted. Dk/nr: <1%