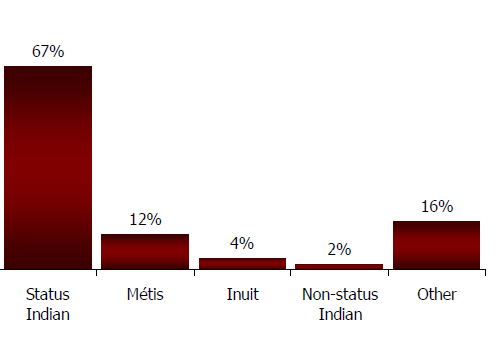
Two-thirds of those surveyed mentioned they were a Status Indian (67%), 12% Métis, 4% Inuit, 2% non-status Indian and 16% indicated another group.
Q88. If you are an Aboriginal person of Canada, please specify the group to which you belong (e.g. Status Indian, Non-status Indian, Métis or Inuit) (optional): (n=51)
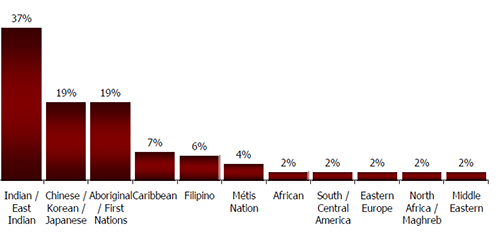
Visible Minorities
Respondents were from various ethnic backgrounds. From East Indian (37%), to Asian (19%), to members of First Nations (19%) many different ethno-cultural communities were represented among CROs.
Q89. If you are a member of a visible minority group, please specify the group that best describes your origin (optional): (n=54)
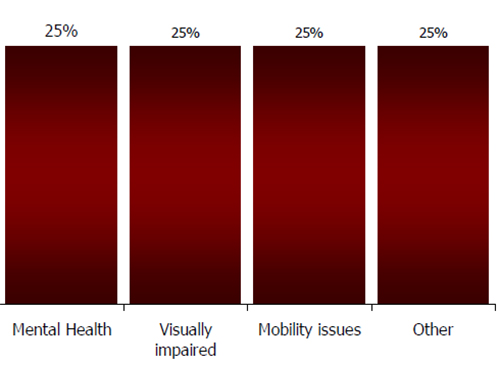
People with Disabilities
Four respondents identified themselves as a person with a disability. This information is presented for informational purposes and carries no statistical weight due to the small sample size.
Q90. If you are a person with a disability, please describe (optional): (n=4) ***
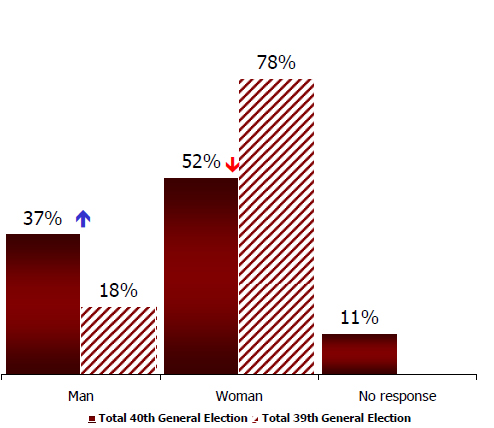
Gender and Age of CROs
Overall, 37% of the CROs surveyed were men, while 52% of them were women. One in ten respondents did not answer (11%).
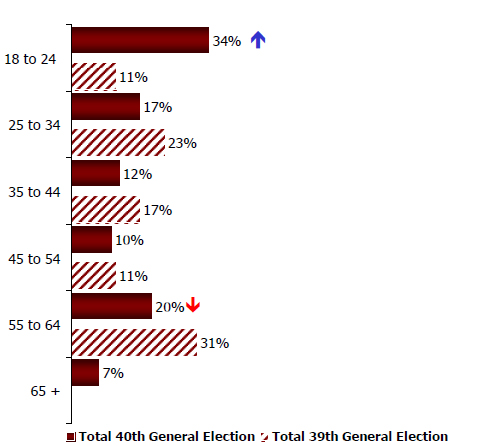
One-third of the CROs (34%) were between the ages of 18 and 24, three out of ten respondents were between the ages of 25 and 44 (29%), and more than one-third were over the age of 45 (37%).
Q91. GENDER
Q92. Age Groups
Languages Known among CROs
Since several communities were present, many various ethno-cultural communities were represented by a member of their respective communities.
English (89%), French (40%), Spanish (10%), Mandarin (6%), Cantonese (5%), Hindi (5%) and Punjabi (5%).
Q93. Please indicate the languages in which you can communicate effectively:
Base : Respondents who know additional languages
 Site Menu