 Site Menu
Electoral Insight – 2004 General Election
Electoral Insight – January 2005
Aboriginal Candidates in the 2004 General Election
Loretta Smith
M.A. candidate, Department of Political Science, University of Guelph
This article summarizes statistical information about Aboriginal candidates in the 2004 general election, as one aspect of the representation of Aboriginal people in Canada's political institutions. Since political parties are one of the main vehicles for political representation, the article analyzes all the self-identified Aboriginal candidates endorsed by each of the five parties that obtained the most support from electors, their electoral districts, their proportion of the vote and the success of their campaigns. The data and analysis suggest that more representation (numeric and substantive) of Aboriginal peoples in our electoral process is necessary.
The information in this article comes from various sources, including the Web sites of Statistics Canada, Elections Canada and the registered political parties, and information provided by representatives of each of the political parties discussed. The political parties included in the analysis are the Bloc Québécois (BQ), Conservative Party of Canada (Conservatives), Green Party of Canada (Greens), Liberal Party of Canada (Liberals), and the New Democratic Party (N.D.P.). The analysis does not include candidates from any party other than the five listed. Footnote 1 The information in this article relies heavily on the process of self-identification. Despite the inherent flaws in using self-identification as the only means of identifying Aboriginal candidates, it is the only means available at this time. Footnote 2
Aboriginal people in Canada

Elections Canadas efforts to make the federal electoral process welcoming to Aboriginal people and encourage their participation included targeted registration in places like this Native Friendship Centre.
According to the most recent census data, Aboriginal people account for approximately 3.3% of the Canadian population. Footnote 3 There are important differences between the Aboriginal population and the total population. For instance, Aboriginal peoples, as a whole, tend to be younger than the total population, with a larger proportion of persons in the under-19 age group. Footnote 4 In terms of gender breakdown, the female-to-male ratio is slightly higher (in favour of females) than in the total population. Footnote 5 The importance of these subtle differences will become apparent in the following discussion.
Aboriginal candidates in the 2004 election
The 2004 general election saw an increase in the number of electoral districts from 301 to 308. Twenty-seven candidates who are self-identified as being Aboriginal persons ran for the five political parties in 25 ridings. The BQ, Conservatives, Greens, Liberals and N.D.P. endorsed a total of 1,307 candidates in the 308 electoral districts. Of their 75 candidates, the BQ endorsed 1 Aboriginal candidate (1.33%). Footnote 6 The Conservatives had 3 self-identified Aboriginal candidates of their total 308 (0.97%). Footnote 7 The Greens surpassed them by one, with 4 Aboriginal candidates out of 308 (1.3%). Footnote 8 The N.D.P. had the second highest number of Aboriginal candidates 8 of their 308 candidates (2.6%). Footnote 9 The Liberals had the greatest number of Aboriginal candidates 11 of their total 308 (3.57%). Footnote 10 Thus the Liberals were the only party in which the percentage of Aboriginal candidates equalled or exceeded the proportion of Aboriginal people in the population as a whole.
How successful were they?
| Electoral district | Liberal | N.D.P. | Green | Conservative | BQ |
|---|---|---|---|---|---|
| Kelowna | Starleigh Grass | ||||
| Skeena–Bulkley Valley | Miles Richardson | ||||
| Athabasca | Robert Cree | Ian Hopfe | |||
| Calgary West | Tim Patterson | ||||
| Macleod | Chris Shade | ||||
| Westlock–St. Paul | Joe Dion | ||||
| Wild Rose | Jeff Horvath | ||||
| Churchill River | Al Ducharme | Earl Cook | |||
| Saskatoon–Wanuskewin | Priscilla Settee | ||||
| Yorkton–Melville | Ted Quewezance | ||||
| Churchill | Ron Evans | ||||
| Winnipeg North | Kris Stevenson | ||||
| Winnipeg South | Rod Bruinooge | ||||
| Brant | Helen-Anne Embry | ||||
| Hamilton Centre | Leon O'Connor | ||||
| Kenora | Carl Chaboyer | ||||
| Middlesex–Kent–Lambton | Kevin Blake | ||||
| Niagara West–Glanbrook | Dave Heatley | ||||
| Simcoe North | Paul DeVillers | ||||
| Louis-Saint-Laurent | Bernard Cleary | ||||
| Pontiac | David Smith | ||||
| Miramichi | Garry Sanipass | ||||
| Labrador | Lawrence O'Brien | ||||
| Western Arctic | Ethel Blondin-Andrew | ||||
| Nunavut | Nancy Karetak-Lindell |
* Candidates identified in bold and italics were elected.
Table 1 shows the Aboriginal candidates in the electoral districts where they sought election. Of the 25 ridings, 23 had only one Aboriginal candidate, one had two Aboriginal candidates (Athabasca), and Churchill River had three Aboriginal candidates (including Rick Laliberte, who ran as an independent and is therefore not included in the tables). The candidates identified in bold and italics were elected.
Of the 27 Aboriginal candidates who sought election for the five leading parties, only six were successful: Ethel Blondin-Andrew (Western Arctic), Bernard Cleary (Louis-Saint-Laurent), Paul DeVillers (Simcoe North), Nancy Karetak-Lindell (Nunavut), Lawrence O'Brien (Labrador), and David Smith (Pontiac). Five of the Aboriginal candidates elected represented the Liberals, while one represented the BQ. Voters did not elect Aboriginal candidates from the other three parties. The provinces of Ontario, Quebec, and Newfoundland and Labrador, as well as the Northwest Territories and Nunavut all had Aboriginal candidates elected.
Candidacies compared to proportion of population
| Province/Territory | Total number of candidates | Number of Aboriginal candidates | Ideal number of Aboriginal candidates | % of candidates who are Aboriginal | % of population that is Aboriginal |
|---|---|---|---|---|---|
| British Columbia | 144 | 2 | 6 | 1.39 | 4.43 |
| Alberta | 112 | 6 | 6 | 5.36 | 5.35 |
| Saskatchewan | 56 | 4 | 8 | 7.14 | 13.61 |
| Manitoba | 56 | 3 | 8 | 5.36 | 13.64 |
| Ontario | 424 | 6 | 7 | 1.41 | 1.68 |
| Quebec | 375 | 2 | 4 | 0.54 | 1.12 |
| New Brunswick | 40 | 1 | 1 | 2.50 | 2.38 |
| Nova Scotia | 44 | 0 | 1 | 0 | 1.90 |
| Prince Edward Island | 16 | 0 | 1 | 0 | 1.01 |
| Newfoundland and Labrador | 28 | 1 | 1 | 3.57 | 3.73 |
| Yukon | 4 | 0 | 1 | 0 | 23.28 |
| Northwest Territories | 4 | 1 | 2 | 25 | 50.96 |
| Nunavut | 4 | 1 | 3 | 25 | 85.22 |
| Total | 1,307 | 27 | 49 | 2.07 | 3.30 |
Table 2 highlights the number of Aboriginal candidates compared to the total number of candidates for the five parties, by province/territory. It also indicates what might be considered the ideal number of Aboriginal candidates, based on the Aboriginal population in that province or territory. Footnote 11 In only 4 of the 13 provinces and territories did the number of Aboriginal candidates closely resemble the Aboriginal proportion of the population. These are Alberta, Ontario, New Brunswick, and Newfoundland and Labrador. Among the areas showing the greatest disparity are Nunavut, British Columbia and Manitoba.
By gender and political party
Table 3 examines Aboriginal candidates by gender and political party. It shows the number of female and male Aboriginal candidates, by party, with comparisons to the total number of candidates and their gender distribution.
| Party | Aboriginal female | Total female | Aboriginal male | Total male | Total |
|---|---|---|---|---|---|
| BQ | 0 | 19 | 1 | 56 | 75 |
| Conservative | 0 | 36 | 3 | 272 | 308 |
| Green | 1 | 78 | 3 | 230 | 308 |
| Liberal | 2 | 74 | 9 | 234 | 308 |
| N.D.P. | 2 | 96 | 6 | 212 | 308 |
| Total | 5 | 303 | 22 | 1,004 | 1,307 |
As discussed previously, the female-to-male ratio is slightly higher among Aboriginal peoples (51.2% female and 48.8% male) than in the total population (50.9% female and 49.1% male). In general, women tend to be under-represented as electoral candidates. Footnote 12 In 2004, they accounted for only 23.1% of all candidates. Aboriginal female candidates are even more under-represented (18.5% of the total number of Aboriginal candidates). Although they are less likely to be selected as candidates, Aboriginal females were more likely to be elected, when compared to all other female candidates. Of the six Aboriginal candidates elected on June 28, two are female (33.3%) and four are male (66.7%). Of the total number of candidates elected, 65 are female (21.1%) and 243 are male (78.9%). However, given the small number of Aboriginal candidates elected, it would not be appropriate to draw broad generalizations from these results.
In terms of representation within political parties, the N.D.P. and the Green Party appear to better represent Aboriginal female candidates, where they made up 25% of the parties' respective total number of Aboriginal candidates. This is not surprising, given that the N.D.P. had a higher percentage of female candidates overall than the other four parties. The Green Party ran male and female Aboriginal candidates at roughly the same proportion as the total distribution of male and female candidates. While in aggregate numbers, the Liberals had the same number of Aboriginal female candidates as the N.D.P. (and one more than the Greens), the Aboriginal female-to-male ratio is smaller in the N.D.P. and Green Party (1:3 N.D.P.; 1:3 Greens; 1:4.5 Liberals). The BQ and Conservatives, however, did not endorse any female Aboriginal candidates.
Support for Aboriginal candidates
The popular vote received by each successful Aboriginal candidate is also noteworthy. In the ridings where Aboriginal candidates were successful, five had a clear plurality of votes (i.e. at least 5% more votes than the next closest candidate). The exception was Western Arctic, which was the subject of a judicial recount. At first count, the difference between Blondin-Andrew and her closest opponent was only 52 votes. After a partial recount, the difference increased by one to 53 votes. Blondin-Andrew won the seat. Footnote 13
The flip side to the success of the six MPs mentioned above is the lack of electoral success for the other 21 candidates. Of particular interest here is the fact that although the N.D.P. ran nearly the same number of Aboriginal candidates as the Liberals, none of the Aboriginal N.D.P. candidates were elected. Moreover, voters did not elect any Aboriginal candidates in British Columbia, Alberta, Saskatchewan, Manitoba, New Brunswick, Nova Scotia, Prince Edward Island or Yukon. This is of particular concern given the very high proportion of Aboriginal people in Yukon, Manitoba and Saskatchewan, and the significant proportion of Aboriginal people in Alberta and British Columbia (see Table 2).
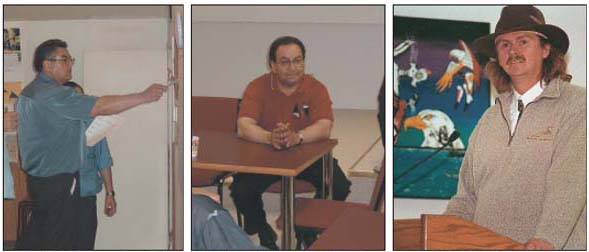
The northern Saskatchewan electoral district of Churchill River had three Aboriginal candidates (left to right): Earl Cook (New Democrat), Al Ducharme (Liberal) and Rick Laliberte (independent).
This lack of Aboriginal representation does not seem to be the result of an absence of Aboriginal candidates. Churchill River, Saskatchewan, provides an interesting example. In this electoral district, Aboriginal people of voting age account for an estimated 68% of the total population aged 18 and over. Footnote 14 In 2004, three Aboriginal candidates vied for success in this riding: Earl Cook (N.D.P.), Al Ducharme (Liberal), and Rick Laliberte (independent). None of the three was elected. In fact, the non-Aboriginal candidate for the Conservatives, Jeremy Harrison, received a clear plurality of the popular vote over the next closest candidate. Footnote 15 In the other 18 ridings where Aboriginal candidates were unsuccessful, each of the successful non-Aboriginal candidates also received a clear plurality of votes. Footnote 16
What accounts for the success of 6 Aboriginal candidates, relative to the lack of success of the other 21 Aboriginal candidates? Are there links between a candidate's degree of success and the popularity of the political party he or she represents? Such a link may offer a possible explanation for why the only Aboriginal candidates to be successful in this election were endorsed by the Liberals and BQ. It does not explain, however, why Aboriginal candidates for the increasingly popular Conservatives were not successful. It is possible that policy considerations might be implicated here, as prominent Aboriginal organizations insisted the Conservative Party clarify its policy on Aboriginal issues. Footnote 17

At an Ottawa news conference, Assembly of First Nations National Chief Phil Fontaine encouraged Aboriginal people to vote and estimated that they had sufficient numbers to be a deciding factor in 63 Canadian electoral districts.
Another possible factor might be the significance of the Aboriginal vote in each electoral district. In the ridings where Aboriginal candidates were successful, the Aboriginal population aged 18 and over varied considerably in size, from a low of 1.51% (Louis-Saint-Laurent) to a high of 75.84% (Nunavut) of the voting-age population. While a higher percentage of Aboriginal voters might suggest greater support for Aboriginal candidates, this does not appear to be an absolute certainty. In ridings such as Athabasca, Churchill, Churchill River and Kenora where Aboriginal electors exceed 20% of the voting-age population, Aboriginal candidates were not successful. Footnote 18 This suggests that more than "shared Aboriginality" is necessary for Aboriginal voters to support an Aboriginal candidate. A desire and ability to vote, Footnote 19 political party affiliation, and policy considerations must be some of the factors at play when Aboriginal voters decide for whom to vote. Other variables, such as the candidate's background, education and political experience, in addition to the demographics and history of the riding are also likely to play a role in determining political success. Further research is necessary to determine the precise role these factors may have played.
Conclusion
As a result of the 2004 general election, 6 of 27 Aboriginal candidates for the five parties were elected, representing a success rate of 22.22%. This result is bittersweet for Aboriginal peoples. While it represents a record number of Aboriginal members of Parliament, Aboriginal persons fill only 1.9% of the seats in the House of Commons far from the 3.3% Aboriginal share of the Canadian population. The disparity here is of continuing concern, and more research is necessary to cover the gaps in the existing literature on Aboriginal voter turnout, Aboriginal candidacy and Aboriginal participation in political parties. I suggest that fair and substantive representation can only come from an increased turnout of Aboriginal persons at the polling stations, increased Aboriginal membership in political parties, an increased number of Aboriginal candidates, and ultimately, an increased number of Aboriginal members of Parliament. Such issues present unique challenges for Canadian policy-makers and Aboriginal peoples alike. With increased roles in such political processes, Aboriginal peoples will be able to ensure their fair and substantive representation in Canada's political institutions.
Notes
Return to source of Footnote 1 The exception is the brief mention of Rick Laliberte, an Aboriginal candidate who ran as an independent in the electoral district of Churchill River.
Return to source of Footnote 2 See, for example, Drew Hayden Taylor, "How Native Is Native if You're Native?" and Bonita Lawrence, "Mixed-Race Urban Native People: Surviving a Legacy of Policies of Genocide," both in Ron Laliberte, Expressions in Canadian Native Studies (Saskatoon, Saskatchewan: University of Saskatchewan Extension Press, 2000).
Return to source of Footnote 3 Statistics Canada, "Aboriginal peoples of Canada," www12.statcan.ca/english/census01/Products/Analytic/companion/abor/canada.cfm.
Return to source of Footnote 4 Statistics Canada, "Population reporting an Aboriginal identity by age groups, provinces and territories (2001 Census)," www.statcan.ca/english/Pgdb/demo40c.htm.
Return to source of Footnote 5 Statistics Canada, "Age and Sex, 2001 Counts for Both Sexes, for Canada, Provinces and Territories 100% Data," www12.statcan.ca/english/census01/products/highlight/AgeSex/Page.cfm?Lang=E&Geo=PR&View=1&Code=0&Table=1a&StartRec=1&Sort=2&B1=Counts&B2=Both.
Return to source of Footnote 6 Official with Bloc Québécois, Personal Communication, June 22, 2004.
Return to source of Footnote 7 Official with Conservative Party of Canada, Personal Communication, June 22, 2004.
Return to source of Footnote 8 Official with Green Party of Canada, Personal Communication, June 22, 2004.
Return to source of Footnote 9 Official with New Democratic Party, Personal Communication, June 22, 2004.
Return to source of Footnote 10 Liberal Party of Canada, "Paul Martin Celebrates Aboriginal Culture," www.liberal.ca/news_e.aspx?site=news&news=793.
Return to source of Footnote 11 This suggestion that the proportion of Aboriginal candidates from each province should closely resemble the proportion of the population that is Aboriginal is premised on a particular model of representation, namely the numerical or pictorial approach. According to this view, "parliamentary institutions should be microcosms of the Canadian electorate, with the same balance of demographic characteristics found in the broader population" (see Keith Archer, Roger Gibbins, Rainer Knopff, Heather MacIvor and Leslie A. Pal, Parameters of Power: Canada's Political Institutions, 3rd ed. (Canada: Thomson, 2002), p. 194. There are, of course, other models of representation, including the partisan model (MPs are seen as representing their parties) and the territorial model (MPs are seen as representing a particular geographical area). In reality, every MP must juggle multiple representational demands. For Aboriginal people, ideal numerical representation in the House of Commons has tended to be difficult to achieve, largely because the Aboriginal population tends not to be geographically concentrated. For a discussion of the implications of this lack of "critical mass," see Kiera L. Ladner, "The Alienation of Nation: Understanding Aboriginal Electoral Participation," in Electoral Insight Vol. 5, No. 3 (November 2003), pp. 2126.
Return to source of Footnote 12 For example, see Lisa Young, "Representation of Women in the Canadian Party System," in William Cross, ed., Political Parties, Representation, and Electoral Democracy in Canada (Don Mills, Ontario: Oxford University Press, 2002).
Return to source of Footnote 13 Elections Canada, "Judicial Recount Terminated in the Electoral District of Western Arctic," www.elections.ca/content.asp?section=med&document=jul2004&dir=pre&lang=e&textonly=false.
Return to source of Footnote 14 Statistics Canada, "2001 Federal Electoral District Profile," www12.statcan.ca/english/census01/products/standard/fedprofile/SelectFED.cfm?R=FED03.
Return to source of Footnote 15 Elections Canada, "Validated Results of the 38th General Election on June 28, 2004," www.elections.ca/content.asp?section=pas&document=index&dir=38e/resval&lang=e&textonly=false.
Return to source of Footnote 16 Elections Canada, "Validated Results of the 38th General Election".
Return to source of Footnote 17 Assembly of First Nations, "National Aboriginal Leaders Call On Stephen Harper To Explain Position On Offensive Writings Of Tom Flanagan, Conservative Party Of Canada's National Campaign Chair," www.afn.ca/Media/2004/june/june_7_04.htm.
Return to source of Footnote 18 Statistics Canada, "2001 Federal Electoral District Profile".
Return to source of Footnote 19 For example, see Elections Canada, Electoral Insight Vol. 5, No. 3 (November 2003).
Note:
The opinions expressed are those of the authors; they do not necessarily reflect those of the Chief Electoral Officer of Canada.