Statistics on staff at Elections Canada Headquarters – CEO Appearance on the Main Estimates 2020–2021
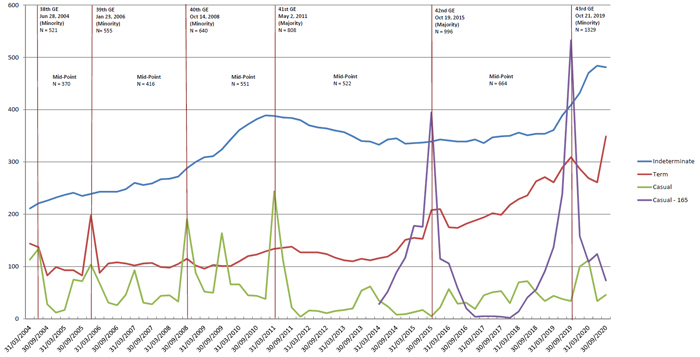
Statistics on Staff at Elections Canada Headquarters - 38th to 43rd General Elections (GE) Headcount Trends - Minority and Majority Governments
Text version of "Statistics on Staff at Elections Canada Headquarters – 38th to 43rd General Elections (GE) Headcount Trends – Minority and Majority Governments"
| Employee type/GE | 38th GE Jun 28, 2004 (Minority) |
39th GE Jan 23, 2006 (Minority) |
40th GE Oct. 14, 2008 (Minority) |
41st GE May 2, 2011 (Majority) |
42nd GE Oct 19, 2015 (Majority) |
43rd GE Oct 21, 2019 (Minority) |
|---|---|---|---|---|---|---|
| Indeterminate | 221 | 239 | 288 | 388 | 339 | 409 |
| Term | 137 | 198 | 115 | 134 | 208 | 309 |
| Casual | 134 | 104 | 191 | 244 | 5 | 34 |
| Casual – 165 days | N/A | N/A | N/A | N/A | 395 | 533 |
| Part Time Worker | N/A | N/A | N/A | N/A | 3 | 4 |
| Secondment | 14 | 8 | 18 | 11 | 22 | 19 |
| Student | 10 | 5 | 26 | 29 | 22 | 18 |
| Interchange | 5 | 1 | 2 | 2 | 2 | 3 |
| Total | 521 | 555 | 640 | 808 | 996 | 1,329 |
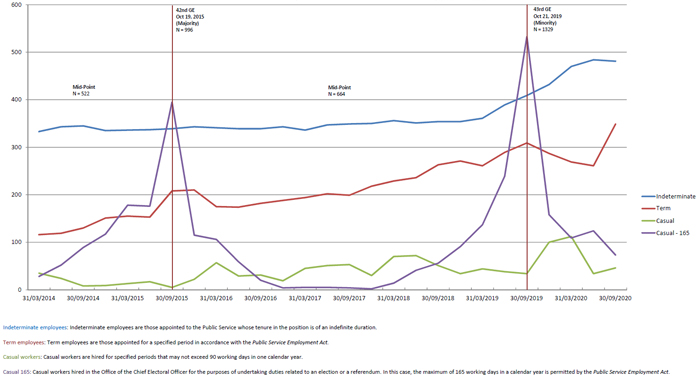
Statistics on Staff at Elections Canada Headquarters - 42nd and 43rd General Elections (GE) Headcount Trends - Preparation of Previous Elections
Text version of "Statistics on Staff at Elections Canada Headquarters – 42nd and 43rd General Elections (GE) Headcount Trends – Preparation of Previous Elections"
| Employee type/GE | 42nd GE Oct 19, 2015 (Majority) |
43rd GE Oct 21, 2019 (Minority) |
|---|---|---|
| Indeterminate | 339 | 409 |
| Term | 208 | 309 |
| Casual | 5 | 34 |
| Casual – 165 days | 395 | 533 |
| Part Time Worker | 3 | 4 |
| Secondment | 22 | 19 |
| Student | 22 | 18 |
| Interchange | 2 | 3 |
| Total | 996 | 1,329 |


