 Site Menu
2018–19 Departmental Plan
Spending and Human Resources
Elections Canada's Financial Framework
Elections Canada's unique dual-funding mechanism and planning practices are a function of its mandate. The agency is funded in part by an annual appropriation that covers the salaries of its indeterminate positions and is not affected by the electoral cycle. The agency also has a statutory authority that allows it to draw directly from the Consolidated Revenue Fund for all other expenses. The statutory authority reflects Elections Canada's independence from the Government. It also ensures that Elections Canada has access to the funds required for elections that may occur at any time.
Under Canada's parliamentary system, general elections are scheduled to take place on fixed dates but can still be called in advance, particularly during a minority government. By-elections, which take place whenever seats in the House of Commons become vacant, are also unpredictable. Legislative changes and market forces for procured goods and services can also significantly impact a general election. For these reasons, Elections Canada does not normally forecast spending related to election delivery activities until the year of a fixed-date election.
Planned Spending
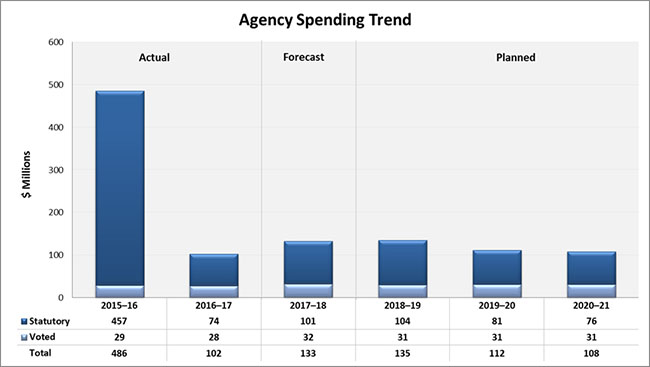
Totals may not add up due to rounding.
Long Description of Agency Spending Trend
| Core Responsibility and Internal Services* | 201516 Expenditures |
201617 Expenditures |
201718 Forecast Spending |
201819 Main Estimates |
201819 Planned Spending |
201920 Planned Spending |
202021 Planned Spending |
|---|---|---|---|---|---|---|---|
| Electoral Administration and Oversight | N/A | N/A | N/A | 94,074,700 | 94,074,700 | 72,489,231 | 67,597,806 |
| Electoral Operations | 331,586,802 | 47,152,229 | 62,015,432 | N/A | N/A | N/A | N/A |
| Regulation of Electoral Activities | 116,777,324 | 12,698,073 | 14,988,738 | N/A | N/A | N/A | N/A |
| Electoral Engagement | 8,244,303 | 8,835,883 | 11,553,342 | N/A | N/A | N/A | N/A |
| Subtotal | 456,608,429 | 68,686,185 | 88,557,512 | 94,074,700 | 94,074,700 | 72,489,231 | 67,597,806 |
| Internal Services | 29,797,925 | 33,745,539 | 44,042,155 | 41,137,302 | 41,137,302 | 39,123,079 | 40,222,174 |
| Total | 486,406,354 | 102,431,724 | 132,599,667 | 135,212,002 | 135,212,002 | 111,612,310 | 107,819,980 |
*Due to changes in Elections Canada's reporting framework starting in fiscal year 201819, annual expenditures by Core Responsibility are not available prior to that year. Previous years are reported under the old Program Alignment Architecture.
The spending pattern is a result of the election cycle and is typical for the agency. Because the 42nd general election was held on October 19, 2015, the peak of expenditures for its conduct occurred in 201516. In the years following an election (such as, here, 201617) expenditures drop sharply, returning to their usual level as election activities wind down. Also in 201617, Elections Canada initiated a process for asset renewal and electoral services modernization, incurring a significant portion of these expenditures in 201718.
Starting in 201819, the agency will increase its field operations as it prepares to conduct the 2019 general election. These planned expenditures do not include at this time the delivery portion of that election for the reasons stated above. In this regard, proposed legislative changes currently before Parliament and the government's intention to introduce further electoral reform could have material impact on the conduct of the next general election and its cost. An estimate of the cost of the 43rd general election will be included in the agency's 201920 Departmental Plan.
Throughout the election cycle, the annual percentage of Internal Services over total expenditures varies significantly. In the years covered above, it varies from 6% to 37%, with an average of 21%.
Planned Human Resources
| Core Responsibility and Internal Services* | 201516 Actual |
201617 Actual |
201718 Forecast |
201819 Planned |
201920 Planned |
202021 Planned |
|---|---|---|---|---|---|---|
| Electoral Administration and Oversight | N/A | N/A | N/A | 475 | 419 | 402 |
| Electoral Operations | 444 | 262 | 298 | N/A | N/A | N/A |
| Regulation of Electoral Activities | 81 | 87 | 83 | N/A | N/A | N/A |
| Electoral Engagement | 68 | 71 | 75 | N/A | N/A | N/A |
| Subtotal | 593 | 420 | 456 | 475 | 419 | 402 |
| Internal Services | 131 | 143 | 184 | 208 | 202 | 204 |
| Total | 724 | 563 | 640 | 683 | 621 | 606 |
*Due to changes in Elections Canada's reporting framework starting in fiscal year 201819, annual FTEs by Core Responsibility are not available prior to that year. Previous years are reported under the old Program Alignment Architecture.
The fluctuation in FTEs is a result of the election cycle, largely explained by the same reasons stated in the Budgetary Planning Summary, above.
Estimates by Vote
For information on Elections Canada's organizational appropriations, consult the 201819 Main Estimates.footnote ii
Future-Oriented Condensed Statement of Operations
The Future-Oriented Condensed Statement of Operations provides a general overview of Elections Canada's operations. The forecast of financial information on expenses and revenues is prepared on an accrual accounting basis to strengthen accountability and to improve transparency and financial management.
Because the Future-Oriented Condensed Statement of Operations is prepared on an accrual accounting basis and the forecast and planned spending amounts presented in other sections of the Departmental Plan are prepared on an expenditure basis, amounts may differ.
A more detailed Future-Oriented Statement of Operations and associated notes, including a reconciliation of the net cost of operations to the requested authorities, can be found on Elections Canada's website.footnote iii
| Financial Information | 201718 Forecast Results |
201819 Planned Results |
Difference (201819 Planned Results Minus 201718 Forecast Results) |
|---|---|---|---|
| Total expenses | 140,500,777 | 139,587,275 | 913,502 |
| Total revenues | - | - | - |
| Net cost of operations before government funding and transfers | 140,500,777 | 139,587,275 | 913,502 |
According to Elections Canada's estimations, the 201819 planned results will be similar to the 201718 forecasted results.